Guides / Mortgage Strategy
15-Year vs 30-Year Mortgage: Which Saves You More Money?
The difference between a 15-year and 30-year mortgage on a $350,000 loan is not a rounding error — it is $768 per month and $262,092 in total interest over the life of the loan. This guide runs every number at fall 2026 rates so you can see exactly what each term costs, where the break-even point falls, and which option fits your budget.
Last updated: September 2026
TL;DR - Quick Answer
- 15-year at 6.20%: $2,991/month, $188,461 total interest, $538,461 total cost on a $350,000 loan
- 30-year at 6.55%: $2,224/month, $450,553 total interest, $800,553 total cost on the same loan
- Monthly difference: $768 — enough to max a Roth IRA ($583/month) with $185 left over
- Break-even on interest savings: Guaranteed from day one — the 15-year saves $262,092 no matter what the market does
- Best for most buyers in fall 2026: 30-year for flexibility, with extra payments when cash flow allows
Use our Mortgage Calculator and Loan Comparison Calculator to model your exact loan amount and rate.
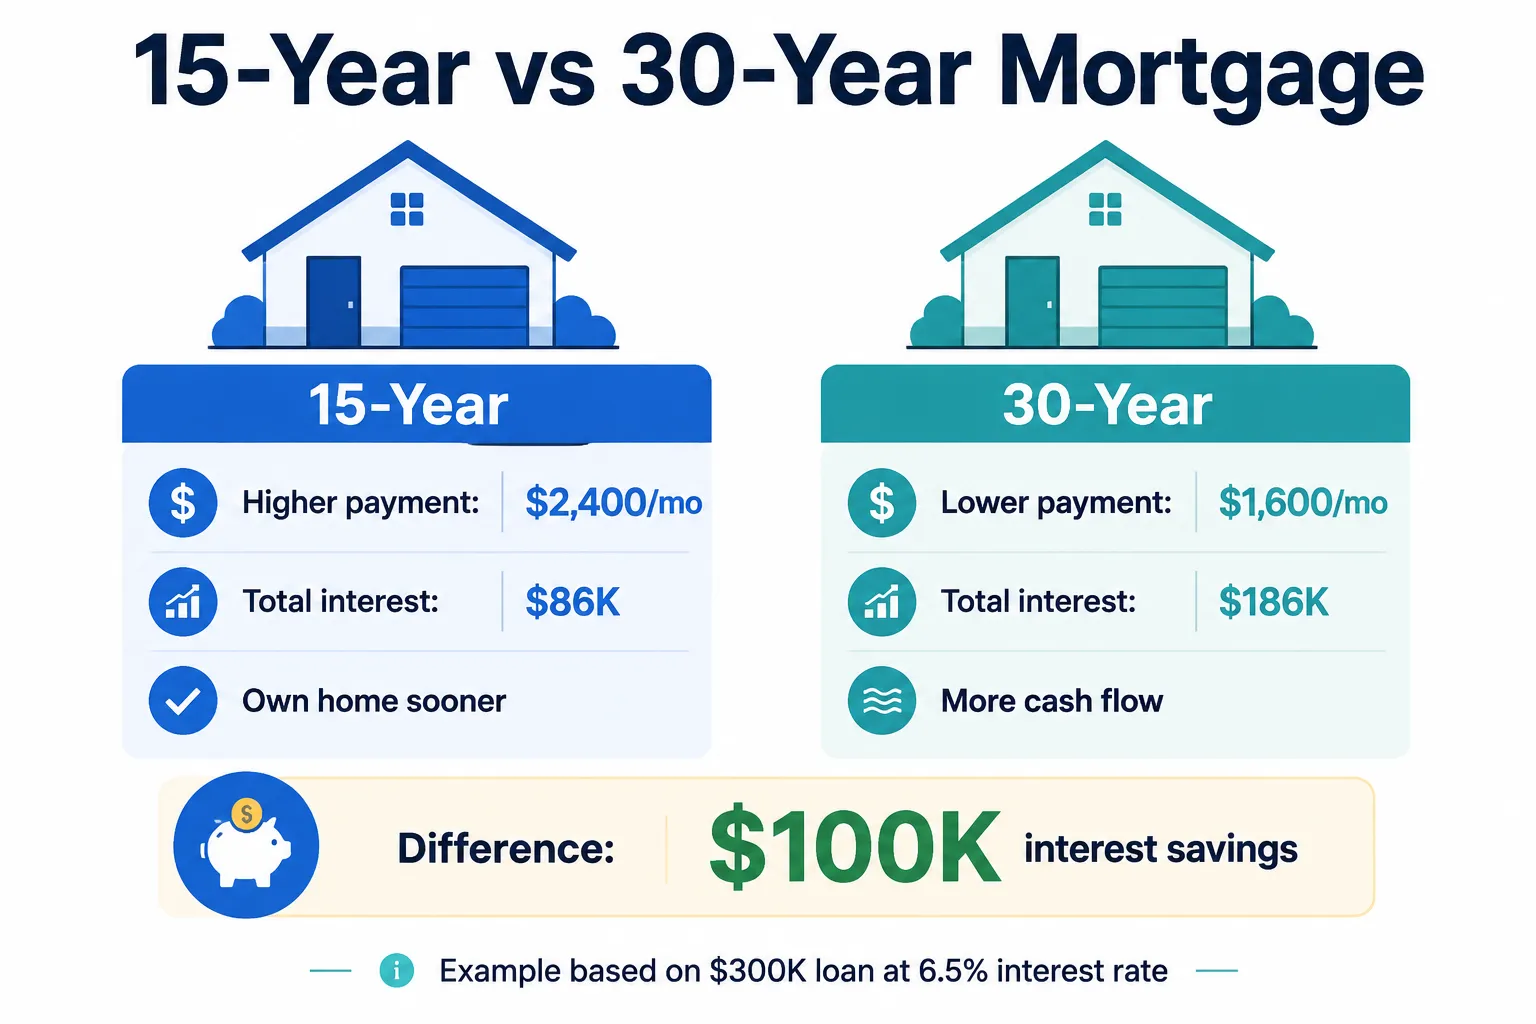
The Real Numbers: $350,000 at Fall 2026 Rates
The national median home price reached $412,300 in Q2 2026, according to the National Association of Realtors. A buyer putting 15% down on a median-priced home borrows roughly $350,000 — a round number that makes the math easy to follow. As of fall 2026, a 15-year fixed mortgage averages 6.20% while the 30-year fixed sits at 6.55%. Rates have eased roughly 0.40 to 0.50 points since summer 2026 as the Federal Reserve signaled further rate cuts. That 0.35-percentage-point gap between terms is typical: 15-year rates have averaged 0.38 points below 30-year rates over the past decade.
On that $350,000 principal, the 15-year payment comes to $2,991 per month. Over 180 payments, you send the lender $538,461 and pay $188,461 in interest. The 30-year payment drops to $2,224 per month — $768 less — but over 360 payments you send $800,553 total and pay $450,553 in interest. That is $262,092 more in interest charges for the privilege of a lower monthly bill.
The trade-off is cash flow versus total cost. The 15-year borrower pays an extra $9,216 per year ($768 x 12) but owns the home outright in 2041 instead of 2056. After 15 years, the 15-year borrower has zero mortgage balance. The 30-year borrower still owes $254,476 and faces 180 more payments totaling $400,277. From year 16 onward, the 15-year borrower has $2,991 per month freed up — while the 30-year borrower continues writing checks.
The opportunity cost matters. If you take the 30-year and invest the $768 monthly difference in a diversified index fund earning 7% annually, that investment grows to $244,749 over 15 years. You still owe $254,476 on the mortgage, so your net position is roughly $9,727 worse off than the 15-year borrower who owns the home free and clear. At a 10% return, the invested portfolio hits $320,837 — enough to pay off the remaining $254,476 balance with $66,361 left over. The break-even investment return sits around 8.0%: above that, the 30-year plus investing wins; below it, the 15-year wins on total wealth.
Closing costs are nearly identical for both terms — typically $6,500 to $8,500 on a $350,000 loan (roughly 2% of the purchase price). Lenders do not charge a premium for the shorter term. The only difference is qualification: because the 15-year payment is $768 higher, you need roughly $2,743 more in monthly gross income to qualify under the 28% housing ratio ($768 / 0.28 = $2,743).
15-Year vs 30-Year: Head-to-Head Comparison
Every figure below assumes a $350,000 loan with no extra payments, property taxes, or insurance. Add $350 to $550 per month for taxes and insurance depending on your state.
| Metric | 15-Year (6.20%) | 30-Year (6.55%) | Difference |
|---|---|---|---|
| Monthly principal + interest | $2,991 | $2,224 | +$768/mo (15yr) |
| Total payments over life of loan | $538,461 | $800,553 | +$262,092 (30yr) |
| Total interest paid | $188,461 | $450,553 | $262,092 saved (15yr) |
| Loan paid off by | Year 15 (2041) | Year 30 (2056) | 15 years sooner |
| Balance after 15 years | $0 | $254,476 | $254,476 remaining |
| Amount paid in first 15 years | $538,461 | $400,277 | +$138,184 (15yr) |
| Invest $768/mo at 7% for 15 years | N/A | $244,749 | Still $9,727 short of payoff |
| Min. gross income (28% rule) | $10,684/mo ($128,205/yr) | $7,942/mo ($95,304/yr) | +$32,901/yr (15yr) |
*Rates reflect fall 2026 national averages (15-year: 6.20%, 30-year: 6.55%). Property taxes, insurance, and PMI not included. Investment return assumes 7% annual average in a taxable brokerage account.
Break-Even Analysis: When Does Each Option Win?
The 15-year mortgage wins on guaranteed interest savings from month one — $262,092 over the full term, with no market risk attached. But the 30-year plus invest strategy closes the gap over time. In year 1, investing the $768 difference at 7% yields $9,512 while you only paid $9,216 extra on the 15-year — a $296 advantage to investing. By year 5, the investment portfolio reaches $54,957 versus $46,080 in cumulative extra 15-year payments, an $8,877 lead.
The crossover happens around year 14, when the invested balance exceeds the cumulative extra payments — but you still owe $254,476 on the mortgage at that point. True wealth parity requires either an 8.0%+ investment return over 15 years or reaching year 15 with a 10% return ($320,837 invested vs. $254,476 owed, a $66,361 surplus). Below 7% returns, the 15-year mortgage builds more net wealth every single year because the guaranteed interest savings outpace mediocre market performance.
Key Insight
The 15-year mortgage is a guaranteed 6.20% return on every extra dollar. To beat it by investing, you need consistent after-tax returns above 6.20% for 15 straight years — more achievable than when rates were 6.75% in summer 2026 (S&P 500 averages 10%), but still not guaranteed. The 2000-2010 decade returned just 1.2% annually. The lower rate environment makes the invest-the-difference strategy slightly more competitive than it was a few months ago.
Who Should Choose a 15-Year vs 30-Year Mortgage
Choose the 15-Year If...
- Your total housing cost (PITI) stays under 28% of gross income — on $145,000/year, that means $3,383/month or less including taxes and insurance
- You have 6+ months of expenses saved ($25,000 minimum on a $3,097/month payment)
- You are 50 or older and want the mortgage paid off before a planned retirement at 65
- You value guaranteed returns over market volatility — $262,092 in interest savings with zero risk
- Your income is stable and unlikely to drop — dual-income household with combined tenure of 5+ years at current employers
Choose the 30-Year If...
- The $768/month difference would strain your budget or prevent retirement contributions (401(k) match, Roth IRA)
- You plan to invest the payment difference — $768/month at 7% grows to $244,749 in 15 years
- Your income is variable (commission, freelance, startup equity) and you need payment flexibility during lean months
- You may move within 10 years — total interest paid on a $350,000 30-year loan sold after 7 years is roughly $168,000 vs. $154,000 on a 15-year, a $14,000 gap that may not justify the higher payment
- You want to qualify for a larger home — the 30-year requires $32,901 less annual income to meet the 28% ratio
Case Study: David and Sarah, $145K Combined Income in Portland, OR
Their Situation
- Combined gross income: $145,000/year ($12,083/month)
- Location: Portland, OR — median home price $485,000
- Purchase price: $418,000 (14% below median)
- Down payment: 20% ($83,600), loan amount: $334,400
- Monthly debts: $380 student loans, $420 car payment
- Emergency fund: $28,000 (6.2 months of expenses)
- 401(k): both contributing 8% with 4% employer match
The Numbers
- Property tax: $348/month (1.0% of value)
- Homeowners insurance: $165/month
- 15-year PITI: $3,371/month (27.9% of gross income)
- 30-year PITI: $2,638/month (21.8% of gross income)
- 15-year total interest: $180,061 over 180 payments
- 30-year total interest: $430,472 over 360 payments
- Total debt ratio (30yr): 28.5% — well within 36% limit
- Total debt ratio (15yr): 34.5% — within limit but tight
What They Chose: 30-Year with a Plan
David and Sarah chose the 30-year at 6.55% ($2,125/month P&I) even though the 15-year now technically fits within lender limits at 34.5% total DTI. Their reasoning: with $2,100/month average childcare costs starting in 2027, the 15-year's $3,371 PITI plus $800 in existing debts leaves just $1,012/month for everything else after childcare — too thin for comfort. Their monthly budget with the 30-year: $2,638 housing + $800 debts + $1,450 groceries and utilities + $800 retirement + $500 savings = $6,188 against $8,200 take-home pay, leaving $2,012 in flex money. They auto-deposit $400/month into a brokerage account (roughly half the $733 payment difference) and plan to refinance to a 15-year when their student loans are paid off in 2029, freeing $380/month. At that point, their projected income of $158,000 makes the 15-year PITI ($3,371) just 25.6% of gross — comfortably within range.
Step-by-Step: How to Choose Your Mortgage Term
Calculate both payments on your exact loan amount
Plug your loan amount into both term options. On $334,400, the difference is $733/month ($2,858 vs. $2,125). On $350,000, it is $768/month. Know your exact number before deciding — a $50,000 difference in loan size shifts the monthly gap by $115.
Run the 28/36 rule with PITI, not just principal and interest
Add property taxes ($300-$600/month in most states), insurance ($120-$250/month), and PMI if putting less than 20% down ($150-$280/month). David and Sarah's 15-year PITI of $3,371 looked manageable on P&I alone ($2,858) but felt tight once student loans, car payments, and upcoming childcare costs were factored in.
Stress-test your budget at the higher payment
Could you cover the 15-year payment if one income dropped by 50% for 6 months? On $145,000 combined income, half is $72,500 ($6,042/month gross). A $3,371 housing payment would consume 55.8% of one income — risky. The $2,638 30-year payment consumes 43.7%, still tight but survivable with their $28,000 emergency fund.
Compare the opportunity cost honestly
Will you actually invest the $768/month difference, or will it absorb into lifestyle spending? Studies show 68% of people who choose a 30-year for "investment flexibility" never invest the difference. If you will not invest it, the 15-year saves $262,092 in guaranteed interest. If you will invest consistently, run the break-even at your expected return rate.
Consider the hybrid: 30-year with extra principal payments
Take the 30-year at $2,224/month and add $400/month in extra principal. You pay off the $350,000 loan in 20 years instead of 30, save $172,795 in interest, and retain the flexibility to skip extra payments during tight months. This is the approach most financial planners recommend for buyers under age 45 in fall 2026.
Run Your Own Numbers
Every loan amount and rate combination produces a different answer. Use our free calculators to compare 15-year and 30-year scenarios on your exact home price and down payment.
Frequently Asked Questions
How much more does a 15-year mortgage cost per month?
On a $350,000 loan at fall 2026 rates, a 15-year mortgage at 6.20% costs $2,991 per month versus $2,224 for a 30-year at 6.55% — a difference of $768 per month. That extra $768 buys you a mortgage-free life 15 years sooner and saves $262,092 in total interest over the life of the loan.
Is a 15-year mortgage always cheaper in the long run?
A 15-year mortgage always saves on total interest — on a $350,000 loan you pay $188,461 in interest versus $450,553 on a 30-year, a $262,092 difference. However, if you invest the $768 monthly payment difference at a 7% average return, your portfolio grows to $244,749 over 15 years. The 15-year still wins on guaranteed savings, but the gap narrows significantly when you factor in investment opportunity cost.
What are typical 15-year and 30-year mortgage rates in fall 2026?
As of fall 2026, the national average 30-year fixed rate sits around 6.40% to 6.70%, while 15-year fixed rates average 6.00% to 6.35% — typically 0.25 to 0.50 percentage points lower. Rates have eased roughly 0.40 to 0.50 points since summer 2026 as the Fed signaled further rate cuts. Freddie Mac's Primary Mortgage Market Survey shows the 15-year rate has averaged 0.38 percentage points below the 30-year rate over the past decade.
Can I switch from a 30-year to a 15-year mortgage later?
Yes, through refinancing. If rates drop further or your income rises, you can refinance a $350,000 remaining balance from a 30-year to a 15-year term. Refinancing costs typically run $3,000 to $6,000 in closing fees, so the break-even point is usually 18 to 36 months of interest savings. Alternatively, you can simulate a 15-year payoff by adding $768 per month in extra principal payments without refinancing.
Who should choose a 15-year mortgage over a 30-year?
Choose a 15-year mortgage if your housing payment stays below 28% of gross income ($3,383/month on a $145,000 salary), you have at least 6 months of emergency savings ($25,000+), you are within 20 years of retirement, or you prioritize guaranteed interest savings over market returns. Skip the 15-year if the higher payment would push your total debt above 36% of income or leave you with less than $15,000 in liquid savings.
How do falling mortgage rates in late 2026 affect the 15-year vs 30-year decision?
Lower rates benefit both terms, but they shrink the absolute dollar gap. At summer 2026 rates (6.75% / 7.0%), the 15-year saved roughly $280,000 in interest on a $350,000 loan. At fall 2026 rates (6.20% / 6.55%), that savings drops to about $262,000. The lower rates also reduce the monthly payment gap, making the 15-year more accessible to more buyers — the extra monthly cost dropped from $769 to $768. If rates continue falling, consider locking a 30-year now and refinancing to a 15-year later if rates drop below 5.5%.
Related Guides
How Much House Can I Afford? Complete Guide by Income Level
Learn exactly how much home you can afford based on your salary, debts, and down payment. Includes income-based tables, a real case study, and the formulas lenders actually use.
Pay Off Mortgage Early vs Invest: The Math Behind the Decision
Should you pay off your mortgage early or invest the extra money? We run the real numbers at today's rates so you can see exactly which option builds more wealth.