How Inflation Works
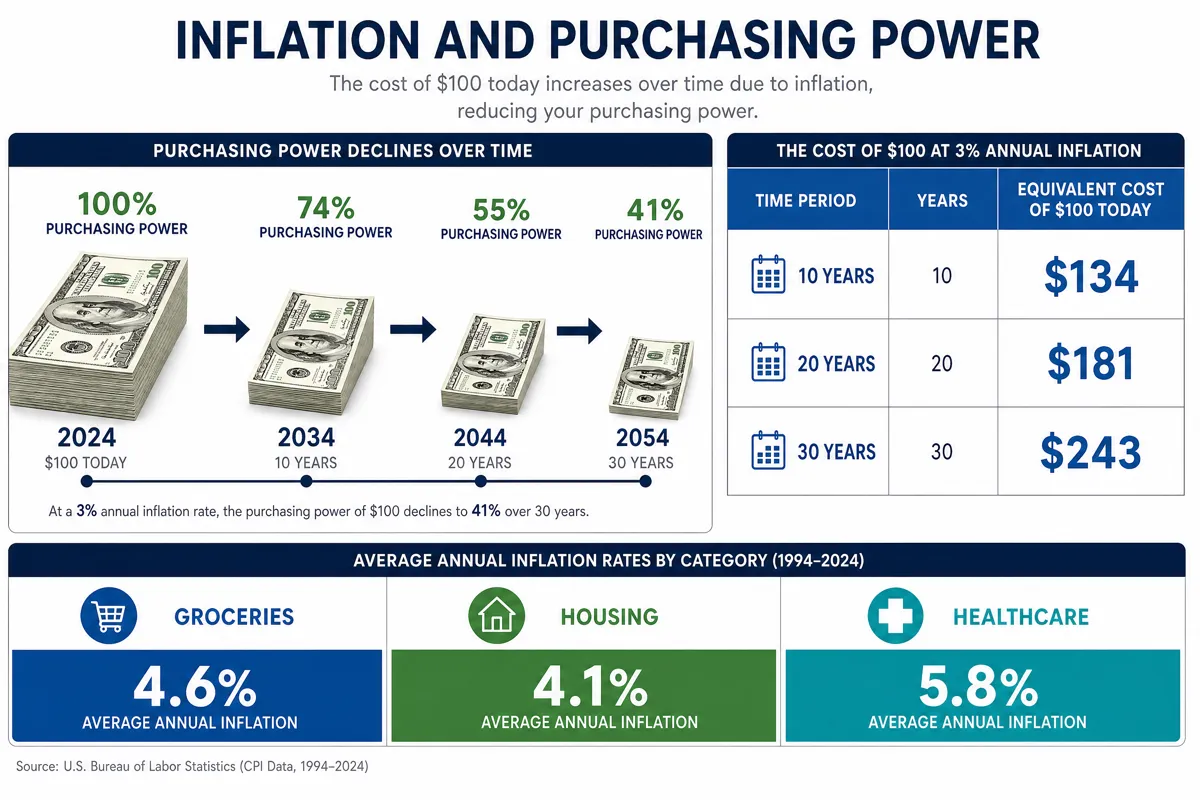
Inflation measures the rate at which the general level of prices for goods and services rises over time, eroding the purchasing power of each dollar you hold. When inflation runs at 3% per year, something that costs $100 today will cost $103 next year, $134 in 10 years, and $243 in 30 years. The effect compounds, which means the damage accelerates the longer you hold cash without earning a return that outpaces inflation.
The U.S. Bureau of Labor Statistics tracks inflation through the Consumer Price Index (CPI), which measures price changes across a basket of goods including food, housing, transportation, medical care, and recreation. The Federal Reserve targets an average annual inflation rate of 2%, but actual inflation has ranged from near-zero to over 9% in recent decades. Understanding your personal inflation rate — weighted toward the categories you spend the most on — is more useful than watching headline CPI alone.
Inflation is not uniformly distributed across categories. Healthcare and education costs have historically inflated at 5-7% annually, far outpacing the 2-3% average for general goods. Housing in high-demand markets has seen similar above-average increases. If your budget skews heavily toward these categories, your effective inflation rate may be double the official figure. Use the calculator above to model different rates and see how they compound over your specific time horizon.
The Rule of 72: A Mental Shortcut
The Rule of 72 provides a quick way to estimate how long it takes for prices to double at a given inflation rate. Divide 72 by the annual rate: at 3% inflation, prices double in roughly 24 years; at 6%, in just 12 years. This mental model is valuable for retirement planning — if you are 30 years old and plan to retire at 65, prices will approximately double during that period at a 2% rate, or triple at 3%. Your retirement savings target must account for this future cost increase, not just today's expenses.
The Rule of 72 also works in reverse for investments. If your savings earn 7% annually, your money doubles roughly every 10 years. The gap between your investment return and the inflation rate is your real return — the only number that matters for building purchasing power. A savings account earning 4% during 3% inflation delivers only a 1% real return, meaning it takes 72 years for your actual buying power to double.
Inflation Categories: What Rises Fastest
Not all prices move at the same rate. The table below shows average annual inflation rates by category over the past two decades, based on CPI component data. These differences have a dramatic compounding effect over 20-30 year horizons.
| Category | Avg Annual Rate | $100 After 20 Years | $100 After 30 Years |
|---|---|---|---|
| General CPI (All Items) | 2.8% | $174 | $228 |
| Healthcare | 5.2% | $275 | $459 |
| College Tuition | 6.0% | $321 | $574 |
| Housing (Shelter) | 3.5% | $199 | $281 |
| Food | 2.6% | $167 | $216 |
| Electronics | -3.0% | $54 | $40 |
Healthcare and education stand out as the two categories that erode purchasing power the fastest. A medical procedure costing $10,000 today will cost approximately $27,500 in 20 years at 5.2% annual inflation. This is why health savings accounts (HSAs) and education-specific investment vehicles like 529 plans are critical — they help your savings grow at rates that can match or exceed these category-specific inflation rates.
Case Study: David, a 35-Year-Old Planning for Retirement
David earns $85,000 per year and spends approximately $4,500 per month on living expenses. He plans to retire at 65, giving him a 30-year planning horizon. At the headline 3% inflation rate, his current $4,500 monthly expense budget will need to cover $10,900 per month in 30 years to maintain the same standard of living. That translates to $131,000 per year in future dollars.
David currently has $95,000 in his 401(k) and contributes $800 per month. Assuming 7% nominal returns and 3% inflation, his portfolio grows to approximately $1,020,000 in nominal terms by age 65. In today's dollars, that is about $420,000 of real purchasing power. Using the 4% safe withdrawal rate, he could draw roughly $16,800 per year in real terms — far short of the $54,000 per year (in today's dollars) he needs.
The gap reveals what many savers miss: a portfolio that sounds large in future dollars may fall dramatically short once inflation is factored in. David increased his contributions to $1,500 per month and shifted his allocation to include more equities and inflation-protected securities. Using our Compound Interest Calculator, he projects that the higher contribution rate puts him on track for roughly $1,800,000 nominal ($740,000 real), generating about $29,600 per year in real withdrawals — much closer to his target when combined with projected Social Security benefits.
Comparison: Different Inflation Scenarios
The table below shows how a $50,000 annual income requirement grows under different inflation assumptions over 10, 20, and 30 years. Even small differences in the inflation rate produce dramatic cost increases over multi-decade horizons.
| Inflation Rate | After 10 Years | After 20 Years | After 30 Years |
|---|---|---|---|
| 2% | $60,950 | $74,300 | $90,570 |
| 3% | $67,200 | $90,300 | $121,360 |
| 4% | $74,010 | $109,560 | $162,170 |
| 5% | $81,440 | $132,660 | $216,100 |
At 2% inflation, your $50,000 need grows to about $90,600 in 30 years. At 5%, the same purchasing power requires $216,100. That is a $125,500 difference driven entirely by a 3 percentage point change in the inflation assumption. This is why financial planners stress-test retirement plans at multiple inflation rates, and why your savings goals should target real (inflation-adjusted) returns rather than nominal ones.
Strategies to Protect Against Inflation
The most reliable inflation hedge for long-term investors is broad equity exposure. Stocks have delivered roughly 7% real (after-inflation) returns over the past century, outpacing inflation by a wide margin. Short-term, stocks are volatile, but over 20-30 year horizons, they have consistently preserved and grown purchasing power better than bonds, cash, or gold.
Treasury Inflation-Protected Securities (TIPS) offer direct inflation protection for the conservative portion of your portfolio. The principal value adjusts with CPI, guaranteeing that your investment keeps pace with official inflation. I Bonds, issued by the U.S. Treasury, provide similar protection with a fixed rate plus a variable inflation adjustment, and are currently one of the few risk-free ways to earn a positive real return.
Real estate has historically appreciated at roughly the rate of inflation plus 1-3%, making it a useful hedge for homeowners. Rental income also tends to rise with inflation, providing a natural income escalator. However, real estate is illiquid and requires active management — it is a hedge, not a substitute for a diversified investment portfolio. Review your overall financial picture with our retirement planning guide to see how inflation protection fits into your broader strategy.
For cash reserves, keep only what you need for emergencies and near-term expenses in savings accounts. Move the rest into investments with positive real returns. Even a high-yield savings account earning 4.5% APY loses purchasing power when inflation exceeds that rate. Use our compound interest examples to see how small differences in real returns compound over decades.
Frequently Asked Questions
What is a good inflation rate to use for planning?
For general financial planning, 3% is the most commonly used estimate. The Federal Reserve targets 2%, but actual inflation has averaged closer to 3% when measured over multi-decade periods. If you are planning for healthcare or education expenses, use 5-6% for those specific categories. Conservative planners run scenarios at both 2% and 4% to bracket uncertainty.
Does inflation affect everyone equally?
No. Inflation hits lower-income households harder because they spend a larger share of income on necessities like food, housing, and energy — categories that often inflate faster than discretionary goods. Retirees living on fixed incomes are also disproportionately affected because their purchasing power declines every year if income does not adjust. Social Security includes cost-of-living adjustments (COLA), but these are based on CPI-W and may not fully reflect retiree spending patterns.
How does inflation affect my savings account?
If your savings account earns 4% APY and inflation is 3%, your real return is approximately 1%. After taxes on the interest (which are assessed on the nominal 4%, not the real 1%), your after-tax real return may be near zero or negative. This is why holding large cash balances long-term is one of the surest ways to lose purchasing power. Move excess cash beyond your emergency fund into tax-advantaged investment accounts.
Can deflation happen?
Yes, deflation (falling prices) has occurred historically, most notably during the Great Depression and briefly during the 2008-2009 financial crisis. While deflation sounds beneficial for consumers, it can trigger a destructive cycle: falling prices reduce business revenue, leading to layoffs, reduced spending, and further price declines. Central banks actively work to prevent sustained deflation, which is why most developed economies experience moderate positive inflation as the norm.
Should I adjust my budget for inflation each year?
Yes. Review your budget annually and increase expense categories by the actual inflation rate for that year. If you do not adjust, you will gradually underspend on savings targets and overspend on discretionary items relative to your plan. Track your actual spending against inflation-adjusted projections to stay on course for long-term goals like retirement and college funding.