Guides / Housing Strategy
Rent vs Buy in 2026: How to Make the Right Decision
"Should I rent or buy a house?" is the question behind every housing search — and the honest answer is not always "buy." With 30-year mortgage rates near 7% in August 2026, the math has shifted. This guide compares real monthly costs, break-even timelines, and a decision framework built on specific numbers, not real estate slogans.
Last updated: August 2026
TL;DR - Quick Answer
- Break-even timeline in 2026: Typically 5–7 years at 7% mortgage rates before buying costs less than renting
- Monthly cost gap: Owning a $380,000 home costs ~$3,054/month vs. $2,200/month rent — an $854/month premium
- Hidden buy costs: $8,000–$15,000 closing fees, 1–2% annual maintenance, plus opportunity cost on your down payment
- Rent if: Moving within 5 years, unstable income, or buying would drain your emergency fund below 3 months
- Buy if: Staying 7+ years, stable dual income, 20% down saved, and total housing stays under 28% of gross pay
Use our Rent vs Buy Calculator to run your exact scenario.
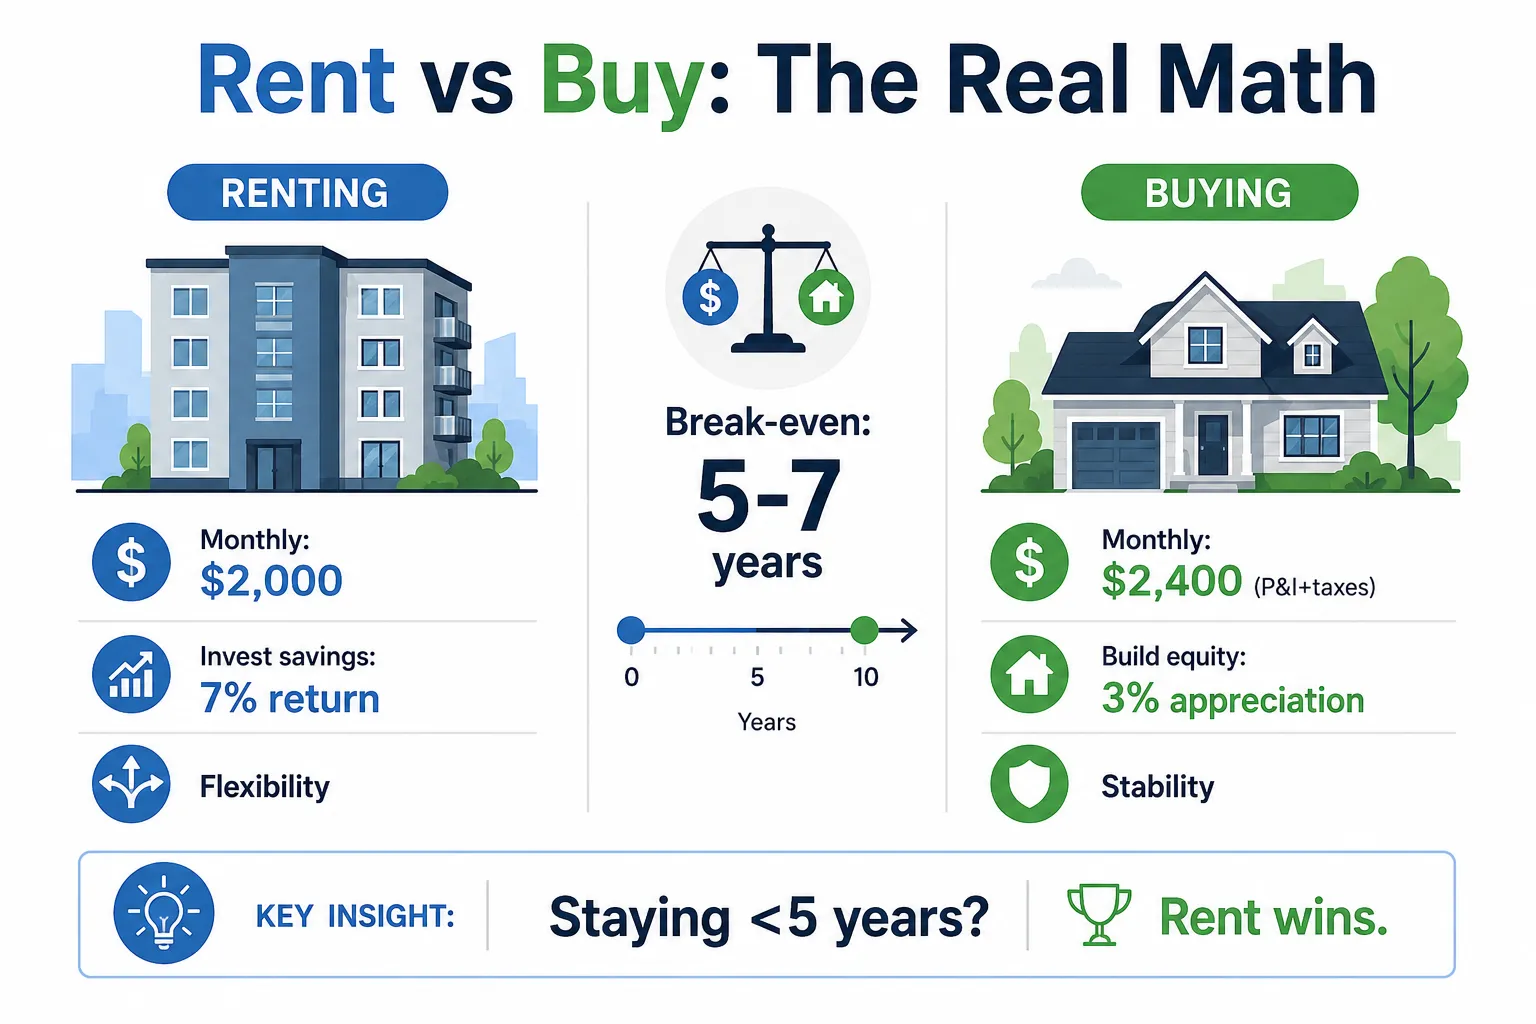
The Real Cost of Buying vs Renting
Most rent-vs-buy debates compare a $2,200 rent check to a $2,041 mortgage payment and declare buying the winner. That comparison ignores $800–$1,200 in monthly costs that homeowners pay and renters never see. At 7% interest on a 30-year fixed loan, the sticker price is only the starting point.
Consider a $380,000 home with 20% down ($76,000). Your loan is $304,000. Principal and interest run $2,041 per month. Property tax at 1.2% adds $380 per month. Homeowner's insurance at 0.5% of value costs $158 per month. Maintenance and repairs at 1.5% of home value — the midpoint of the 1–2% rule — add $475 per month. Your true monthly ownership cost is $3,054, not $2,041. That is $854 more than the $2,200 rent payment next door.
Upfront costs widen the gap further. Closing costs on a $380,000 purchase typically run $8,000 to $15,000 (2–4% of the purchase price). Title insurance, appraisal fees, lender origination charges, and prepaid property taxes all hit at closing. A $76,000 down payment plus $11,400 in closing costs means $87,400 leaves your bank account before you hang a single picture.
Then there is opportunity cost — the investment return you give up by tying cash in a house. If you invested that $76,000 down payment in a diversified index fund earning 7% annually, it would grow to roughly $149,700 over 10 years. Even parked in a 4.8% high-yield savings account, it earns $3,648 per year risk-free. Renters keep that capital liquid and invested; buyers convert it to illiquid home equity.
Hidden Costs Most Renters Never Pay
| Cost Category | Renting ($2,200/mo) | Buying ($380K home) |
|---|---|---|
| Monthly housing payment | $2,200 | $2,041 (P&I) |
| Property tax | $0 | $380 |
| Homeowner's insurance | $0 (renter's ~$18) | $158 |
| Maintenance & repairs (1.5%/yr) | $0 | $475 |
| Upfront costs | $2,200 (deposit) | $87,400 (down + closing) |
| True monthly cost | $2,200 | $3,054 |
*Assumes $380,000 purchase, 20% down, $304,000 loan at 7.0% for 30 years, 1.2% property tax, 0.5% insurance. Maintenance at 1.5% of home value per year.
Important Caveat
Renters who invest the $854 monthly difference ($10,248/year) at a 7% average return build a $148,600 portfolio over 10 years — on top of keeping their $76,000 down payment invested. Buying only wins if home appreciation and equity paydown exceed that combined $225,000+ in renter wealth.
Break-Even Analysis: How Long Must You Stay?
The break-even point is when the total cost of buying equals the total cost of renting, accounting for equity gained through mortgage paydown and home appreciation. In 2026, with 30-year fixed rates averaging 6.875% to 7.125%, that timeline has stretched compared to the 3% rate era when break-even often hit in 3 to 4 years.
On the $380,000 home scenario above, buying starts $854 per month more expensive than renting from day one. Over the first year, that gap totals $10,248 in extra out-of-pocket costs, plus $11,400 in closing fees — $21,648 before a single dollar of equity from appreciation. At 3% annual home appreciation, the property gains $11,400 in value in year one. Mortgage principal paydown adds roughly $3,800. Combined, you recover about $15,200 against $21,648 in excess costs — still underwater by $6,448 after year one.
By year 5, cumulative extra ownership costs reach approximately $62,640 ($854/month x 60 months + $11,400 closing). Equity from appreciation ($60,200 at 3%/year) plus principal paydown ($20,500) totals $80,700 — putting the buyer ahead by roughly $18,060. The break-even point lands between years 4 and 5 in this scenario.
At 7% mortgage rates, most financial planners cite 5 to 7 years as the typical break-even range nationally. High-appreciation markets like Austin or Charlotte may break even in 4 to 5 years. Slow-growth or declining markets — parts of the Midwest and Northeast with flat prices — can take 8 to 10 years. If you sell before break-even, you also pay 5–6% in agent commissions ($19,000–$22,800 on a $380,000 home), which can erase another year of equity gains.
The 7% rate environment changes the calculus in one more way: more of your early payments go to interest. On a $304,000 loan at 7%, you pay $21,168 in interest in year one versus only $3,832 toward principal. At 3%, that ratio was roughly $9,000 interest and $6,800 principal. Higher rates slow equity accumulation, pushing break-even further out.
Side-by-Side: $2,200/Month Rent vs. $380,000 Home Purchase
The table below compares renting at $2,200/month against buying a $380,000 home with 20% down ($76,000), a $304,000 mortgage at 7.0%, and $11,400 in closing costs. Rent assumes 3% annual increases. Home assumes 3% annual appreciation.
| Metric | Rent ($2,200/mo) | Buy ($380K home) |
|---|---|---|
| Monthly cost (year 1) | $2,200 | $3,054 |
| Upfront cash required | $2,200 (deposit) | $87,400 (down + closing) |
| 5-year total housing spend | $140,160 | $270,640 |
| 5-year equity / net position | $0 equity | ~$156,900 equity |
| 5-year net cost (spend minus equity) | $140,160 | ~$113,740 |
| 10-year total housing spend | $303,500 | $453,880 |
| 10-year equity / net position | $0 equity | ~$250,700 equity |
| 10-year net cost (spend minus equity) | $303,500 | ~$203,180 |
| Break-even timeline | N/A | ~5 years |
| Flexibility to relocate | 30-day notice | 3–6 months to sell |
*Net cost = total cash spent minus home equity (down payment + principal paydown + appreciation). Does not include opportunity cost of invested down payment or selling costs. Rent total includes 3% annual increases.
Case Study: Kevin and Lisa, $125K Combined, Charlotte, NC
Their Situation
- Combined gross income: $125,000/year ($10,417/month)
- Take-home pay: ~$7,800/month after taxes and 401(k)
- Current rent: $2,100/month for a 2-bedroom apartment
- Target purchase: $350,000 townhouse in South Charlotte
- Savings: $72,000 ($52,000 earmarked for down payment)
- Existing debts: $320/month (student loans + one car)
- Both employed 4+ years, expect to stay 8–10 years
The Numbers
- Down payment (20%): $70,000 on $350,000 purchase
- Loan amount: $280,000 at 7.0%, 30-year fixed
- P&I payment: $1,862/month
- Property tax: $280/month (0.96% Mecklenburg rate)
- Insurance: $146/month
- Maintenance (1.5%): $438/month
- True monthly ownership cost: $2,726/month
- Closing costs: ~$10,500
The Decision
Kevin and Lisa face a $626/month premium to own ($2,726 vs. $2,100 rent). Their total housing cost would be 26.2% of gross income — within the 28% guideline. Total debt ratio with their $320/month obligations hits 29.3%, well under the 36% lender limit. Charlotte's market has appreciated 4.2% annually over the past five years, which shortens their break-even to roughly 4.5 years.
They chose to buy — but with conditions. They kept $20,000 of their $72,000 savings as an emergency fund (2.6 months of expenses) rather than pushing to a 25% down payment. They budget $438/month for maintenance from day one. Lisa's employer requires in-office presence, and Kevin's remote role is stable for at least 3 years with a contract extension likely. Their 8–10 year horizon exceeds the 4.5-year break-even, and Charlotte's below-national-average prices ($350,000 vs. $412,300 median) make the equity math favorable. If either had expected a move within 5 years, renting at $2,100 and investing the $626 difference would have been the smarter financial move.
When Renting Is the Smarter Financial Move
Renting is not a failure — it is often the optimal choice. Here are the situations where signing a lease beats signing a mortgage in 2026:
- You plan to move within 5 years. Selling costs (5–6% commission), closing costs, and the front-loaded interest on a 7% mortgage mean short-term owners rarely come out ahead. A 3-year stay on a $380,000 home typically costs $35,000–$45,000 more than renting after selling fees.
- Your income is unstable or variable. Commission sales, freelance work, startup equity, or a single-income household with one partner considering a career change all increase risk. A $3,054 monthly ownership cost is fixed; a $2,200 lease gives you flexibility to downsize if income drops 30%.
- Local home prices are elevated relative to rents.When the price-to-rent ratio exceeds 20 (home price divided by annual rent), buying rarely makes financial sense. A $380,000 home renting for $2,200/month has a ratio of 14.4 — borderline. In San Francisco, where a $1.2 million condo rents for $3,500/month (ratio 28.6), renting is almost always cheaper.
- You need career flexibility.Relocating for a $25,000 raise, accepting a 2-year assignment in another city, or pursuing an advanced degree all favor renting. Breaking a lease costs 1–2 months' rent ($2,200–$4,400). Selling a home costs $19,000–$22,800 plus 60–120 days on market.
- Buying would drain your emergency fund below 3 months.If a $70,000 down payment plus $10,500 closing costs leaves you with less than $15,000 in liquid savings on a $5,000/month budget, one HVAC failure ($8,000) or job loss creates a crisis. Renters call the landlord; homeowners write the check.
When Buying Makes Financial Sense
Buying builds wealth through forced savings (mortgage principal paydown) and appreciation — but only if you stay long enough and buy within your means. These conditions favor purchasing in 2026:
- You will stay 7 or more years.At 7% rates, year 7 is where cumulative equity ($120,000+ on a $380,000 home at 3% appreciation) typically exceeds the total premium paid over renting plus all transaction costs. Every year beyond 7 widens the gap in the buyer's favor.
- You have stable, predictable income. Dual-income households with 5+ years at current employers, W-2 salaried roles, and total housing under 28% of gross income ($2,917/month on $125,000/year) can absorb the $854/month ownership premium without sacrificing retirement savings or emergency fund contributions.
- You can put 20% down without touching your emergency fund.A $76,000 down payment on a $380,000 home plus $11,400 closing costs requires $87,400 upfront — and you should still have $20,000–$30,000 in liquid savings afterward. Kevin and Lisa kept $20,000 in reserve; that discipline is what makes buying safe.
- You want to build equity and control your housing costs.A fixed 7% mortgage payment stays $2,041 for 30 years while rent rises 3% annually ($2,200 today becomes $2,960 in 10 years). After year 10, the buyer's monthly cost advantage grows every year as rent climbs and the mortgage stays flat.
- Tax benefits apply to your situation. If you itemize deductions and your combined mortgage interest ($21,168 in year one on a $304,000 loan) plus property taxes exceed the $29,200 standard deduction (2026 married filing jointly), the mortgage interest deduction lowers your effective rate. In the 22% bracket, a 7% mortgage effectively costs 5.46% after deduction. Only about 10% of filers itemize, so verify this applies to you.
Step-by-Step Decision Framework
Work through these five steps in order. Each one either qualifies you to buy or points you toward renting for now.
Confirm your timeline: how long will you stay?
If the answer is under 5 years, rent unless you have a strong reason unrelated to money (aging parents nearby, kids in a specific school district with no rental options). At 7% rates, break-even requires at least 5 years in most markets. Write down a realistic year count — not "forever," but "until 2033 when our youngest starts college."
Calculate true monthly cost for both options
For buying, add P&I + property tax + insurance + maintenance (1–2% of home value/year). For renting, include renter's insurance (~$18/month). Compare the gap — if it exceeds 25% of your take-home pay, buying may strain your budget. On $7,800 take-home, a $626/month gap (Kevin and Lisa) is 8% — manageable. A $1,200 gap would be 15.4% — risky.
Verify you can afford the down payment plus reserves
You need 20% down ($70,000 on a $350,000 home), $8,000–$15,000 closing costs, and 3–6 months of expenses ($15,000–$30,000) remaining in savings after closing. Total required: roughly $93,000–$115,000 in accessible funds. If you have $72,000 total, you are not ready to buy a $350,000 home — Kevin and Lisa had just enough because their target price matched their savings.
Run the break-even calculation for your market
Plug your rent, target home price, down payment, rate, and expected appreciation into our Rent vs Buy Calculator. If break-even exceeds your planned stay by 2+ years, renting wins on math alone. Charlotte at 4.2% appreciation broke even in 4.5 years for Kevin and Lisa; a flat market at 1% would push that to 7+ years.
Factor in non-financial priorities, then decide
Stability for children, freedom from landlord rules, ability to renovate, and pride of ownership have real value — but assign them a dollar figure. If owning costs $626/month more and break-even is 4.5 years, you are paying $33,800 in premium over 4.5 years for intangibles. If that trade-off feels worth it and steps 1–4 check out, buy. If the math fails step 4, rent and revisit when rates drop or your timeline lengthens.
Run Your Rent vs Buy Numbers
Every market, income, and timeline produces a different answer. Use our free calculators to compare your exact rent payment against the true cost of owning.
Frequently Asked Questions
Should I rent or buy a house in 2026?
In 2026 with 7% mortgage rates, renting usually wins financially if you plan to move within 5 years. Buying makes sense when you will stay 7+ years, have stable income, and can cover a 20% down payment plus $8,000–$15,000 in closing costs without draining your emergency fund. Run your exact numbers with a rent-vs-buy calculator before deciding.
How long do you need to stay to break even on buying vs renting?
At August 2026 rates (roughly 7% on a 30-year fixed), the typical break-even point is 5 to 7 years in most US markets. Closing costs of $8,000–$15,000, 1–2% annual maintenance, and the opportunity cost of your down payment all delay the point where buying costs less than renting. In high-cost cities like San Francisco or New York, break-even can stretch to 8–10 years.
Is renting throwing money away?
No. Rent buys you housing and flexibility. On a $2,200/month lease, you pay $26,400 per year for shelter with zero maintenance bills, no property tax, and no $12,000 roof replacement risk. The money you save on down payment ($76,000 on a $380,000 home) can earn 4.5–5.0% in a high-yield savings account or 7–10% invested — returns you forfeit when you buy.
What hidden costs make buying more expensive than the mortgage payment?
Beyond principal and interest, homeowners pay property tax (typically 0.8–1.5% of home value per year), insurance ($1,400–$2,400/year), maintenance and repairs (1–2% of home value annually), closing costs ($8,000–$15,000 upfront), and selling costs (5–6% agent commission when you move). On a $380,000 home, the true monthly cost is often $800–$1,200 higher than the mortgage payment alone.
Does buying always build more wealth than renting?
Not automatically. A renter who invests the down payment ($76,000) and monthly cost difference ($850/month on a $380,000 home scenario) at a 7% average return accumulates roughly $215,000 over 10 years. A buyer builds equity through mortgage paydown and appreciation, but pays $280,000+ in interest over 30 years at 7%. Wealth building depends on how long you stay, local appreciation rates, and whether you actually invest the savings from renting.
Related Guides
How Much House Can I Afford? Complete Guide by Income Level
Learn exactly how much home you can afford based on your salary, debts, and down payment. Includes income-based tables, a real case study, and the formulas lenders actually use.
15-Year vs 30-Year Mortgage: Which Saves You More Money?
Compare 15-year vs 30-year mortgages with real numbers on a $350K loan. See monthly payments, total interest, break-even analysis, and who should choose each term.