What Is a Break-Even Analysis?
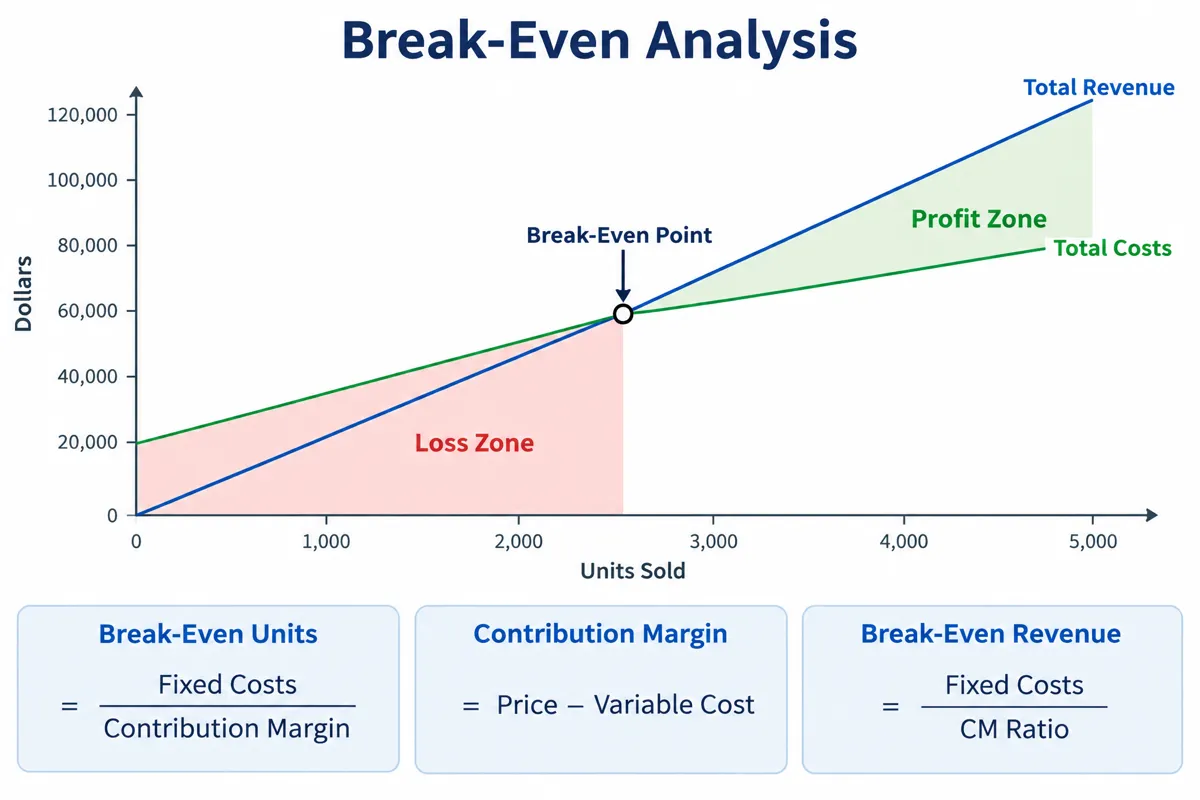
A break-even analysis tells you exactly how many units you need to sell, or how much revenue you need to generate, before your business covers all of its costs and starts earning a profit. Below that threshold, every dollar of revenue goes toward paying off fixed expenses like rent, payroll, and insurance. Above it, each additional sale contributes directly to your bottom line. Whether you are launching a new product, evaluating a price change, or pitching investors, the break-even point is one of the most fundamental numbers in business finance.
The concept applies far beyond traditional businesses. Freelancers use break-even analysis to determine how many billable hours they need each month to cover overhead. E-commerce sellers calculate how many orders justify a warehouse lease versus fulfilling from home. Even side-hustle operators selling handmade goods on Etsy can use break-even math to decide whether a craft fair booth fee is worth the investment. The formula is the same in every case: divide your fixed costs by the contribution margin per unit to find the exact sales volume where you stop losing money.
How the Break-Even Formula Works
The break-even point in units is calculated with a straightforward formula: Break-Even Units = Fixed Costs / (Price per Unit - Variable Cost per Unit). The denominator, price minus variable cost, is called the contribution margin. It represents how much each unit sold contributes toward covering fixed costs. Once enough units have been sold to fully cover fixed costs, every additional unit generates pure profit equal to its contribution margin.
To find the break-even point in dollars instead of units, use: Break-Even Revenue = Fixed Costs / Contribution Margin Ratio, where the contribution margin ratio equals the contribution margin divided by the selling price. A $50 product with a $25 variable cost has a contribution margin of $25 and a margin ratio of 50%. With $10,000 in fixed costs, you need $10,000 / 0.50 = $20,000 in revenue to break even, which equals 400 units at $50 each.
If you want to go beyond break-even and hit a target profit, modify the formula: Units for Target Profit = (Fixed Costs + Target Profit) / Contribution Margin. Treat your desired profit as an additional fixed cost that must be covered. A business with $10,000 in fixed costs and a $5,000 profit target needs to cover $15,000 total, which at a $25 contribution margin means selling 600 units.
Key Concepts in Break-Even Analysis
Fixed costs are expenses that remain constant regardless of how many units you produce or sell. Rent, insurance premiums, salaried payroll, loan payments, and software subscriptions are typical fixed costs. A bakery paying $3,000 per month in rent owes that amount whether it sells 100 cupcakes or 10,000. Fixed costs create the hurdle that sales volume must clear before profitability begins.
Variable costs change in direct proportion to production volume. Raw materials, packaging, shipping fees, payment processing charges, and sales commissions are variable costs. If a candle maker spends $4 on wax and supplies per candle, producing 500 candles costs $2,000 in variable expenses, while producing 1,000 candles costs $4,000. Variable costs determine the floor below which you cannot price your product without losing money on every sale.
Contribution margin is the single most important number in break-even analysis. It equals the selling price minus the variable cost per unit. A product priced at $80 with a $30 variable cost has a $50 contribution margin, meaning each sale contributes $50 toward covering fixed costs. Higher contribution margins mean fewer sales are needed to break even. Businesses can increase their margin by raising prices, reducing variable costs through better supplier negotiations, or improving production efficiency.
Understanding contribution margin also helps you evaluate which products in a multi-product business deserve more marketing investment. Use our ROI Calculator to compare the return on marketing spend for products with different margins and identify where each advertising dollar generates the most profit.
Case Study: Sarah's Online Candle Business
Sarah, a 29-year-old marketing professional in Austin, Texas, launches a handmade soy candle business on the side. She invests in the following monthly fixed costs: shared kitchen rental at $800, Shopify subscription at $39, liability insurance at $75, and a social media management tool at $86 -- totaling $1,000 per month in fixed expenses. Each candle costs $8.50 in variable costs: $4.00 for soy wax and fragrance oil, $1.50 for the glass jar and lid, $1.00 for the label and packaging, and $2.00 for shipping materials and postage.
Sarah prices her candles at $28 each. Her contribution margin is $28 - $8.50 = $19.50 per candle. To find her break-even point: $1,000 / $19.50 = 51.3, rounded up to 52 candles per month. At $28 each, that equals $1,456 in monthly revenue just to cover all costs. Every candle sold beyond 52 generates $19.50 in pure profit.
If Sarah wants to earn $2,000 per month in profit from the business, she needs to sell ($1,000 + $2,000) / $19.50 = 154 candles per month, generating $4,312 in revenue. This target helps Sarah plan inventory, set production schedules, and budget for advertising. She decides to allocate $300 per month to Instagram ads, which raises her fixed costs to $1,300 and her break-even to 67 candles. If the ads generate at least 16 additional sales per month at $19.50 margin each ($312 in contribution), the ad spend more than pays for itself.
Sarah tracks her monthly revenue against her break-even target using a simple spreadsheet alongside our calculator. She also uses our 50/30/20 Budget Calculator to ensure her side-hustle income is properly allocated between reinvesting in inventory (needs), personal spending (wants), and building an emergency fund (savings).
Price Sensitivity: How Pricing Changes Affect Your Break-Even Point
| Price per Unit | Contribution Margin | Break-Even Units | Break-Even Revenue | Impact |
|---|---|---|---|---|
| $22.00 | $13.50 | 75 | $1,650 | +44% more units needed |
| $25.00 | $16.50 | 61 | $1,525 | +17% more units needed |
| $28.00 (current) | $19.50 | 52 | $1,456 | Baseline |
| $32.00 | $23.50 | 43 | $1,376 | -17% fewer units needed |
| $35.00 | $26.50 | 38 | $1,330 | -27% fewer units needed |
The table above uses Sarah's candle business numbers ($1,000 fixed costs, $8.50 variable cost) to show how sensitive the break-even point is to pricing decisions. A modest $4 price increase from $28 to $32 reduces the break-even volume by 9 units, or 17%. Conversely, a $6 price cut to $22 requires selling 23 more candles each month just to cover the same fixed costs. This asymmetry is why pricing strategy is one of the most powerful levers in business profitability.
Practical Tips for Using Break-Even Analysis
- Separate fixed and variable costs carefully. Some costs are semi-variable: a sales rep on a base salary plus commission has both fixed and variable components. Split these costs into their fixed and variable portions for an accurate analysis. The base salary is fixed; the commission percentage is variable.
- Run scenarios before making decisions. Before signing a lease, hiring an employee, or launching an ad campaign, plug the new fixed cost into the calculator and see how it shifts your break-even point. A $500/month expense increase with a $25 contribution margin means selling 20 more units each month just to stay at zero.
- Use break-even analysis alongside ROI. Break-even tells you when you stop losing money; ROI tells you how efficiently your investment generates returns. Read our guide on calculating ROI to pair both metrics for complete financial decision-making.
- Update your analysis regularly. Supplier price changes, rent increases, and shifts in consumer demand all affect your break-even point. Revisit the calculation quarterly or whenever a major cost changes. A 10% increase in raw material costs can raise your variable cost enough to add dozens of units to your break-even target.
- Factor in multiple products. If you sell products at different price points and margins, calculate a weighted-average contribution margin based on your sales mix, then use that average in the break-even formula. This gives a composite break-even revenue target for the entire business.
Tracking your break-even point over time also helps you build a savings strategy for your business. Our Savings Goal Calculator can help you determine how much profit to set aside each month to build a cash reserve that covers three to six months of fixed costs, insulating your business from seasonal slowdowns or unexpected expenses.
FAQ
What is a break-even point? The break-even point is the exact number of units you must sell, or the total revenue you must earn, for your total revenue to equal your total costs. Below this point, you operate at a loss. Above it, every additional unit sold generates profit. For a business with $10,000 in monthly fixed costs selling a product at $50 with a $25 variable cost, the break-even point is 400 units, or $20,000 in revenue.
How do I calculate break-even in dollars instead of units? Divide your fixed costs by the contribution margin ratio (contribution margin divided by price per unit). If your price is $50 and variable cost is $25, the contribution margin ratio is 50%. With $10,000 in fixed costs: $10,000 / 0.50 = $20,000 in break-even revenue. This approach is especially useful for service businesses or companies with many product lines.
What happens if my variable cost is higher than my price? If your variable cost exceeds your selling price, you have a negative contribution margin, which means you lose money on every unit sold. No amount of sales volume can overcome this deficit. You must either raise your price or reduce your variable costs before a break-even point can exist.
How does break-even analysis help with pricing? By running price sensitivity scenarios in the calculator, you can see exactly how a price increase or decrease affects the number of units you need to sell. A small price increase often reduces the break-even volume dramatically because it widens the contribution margin. This analysis helps you find the optimal balance between price competitiveness and profitability.
Can I use break-even analysis for a service business?Yes. For service businesses, treat your hourly or project rate as the "price per unit" and any per-project costs (subcontractors, materials, travel) as variable costs. Fixed costs include rent, software, insurance, and your own salary draw. The formula works identically, with each billable hour or project replacing a physical unit.