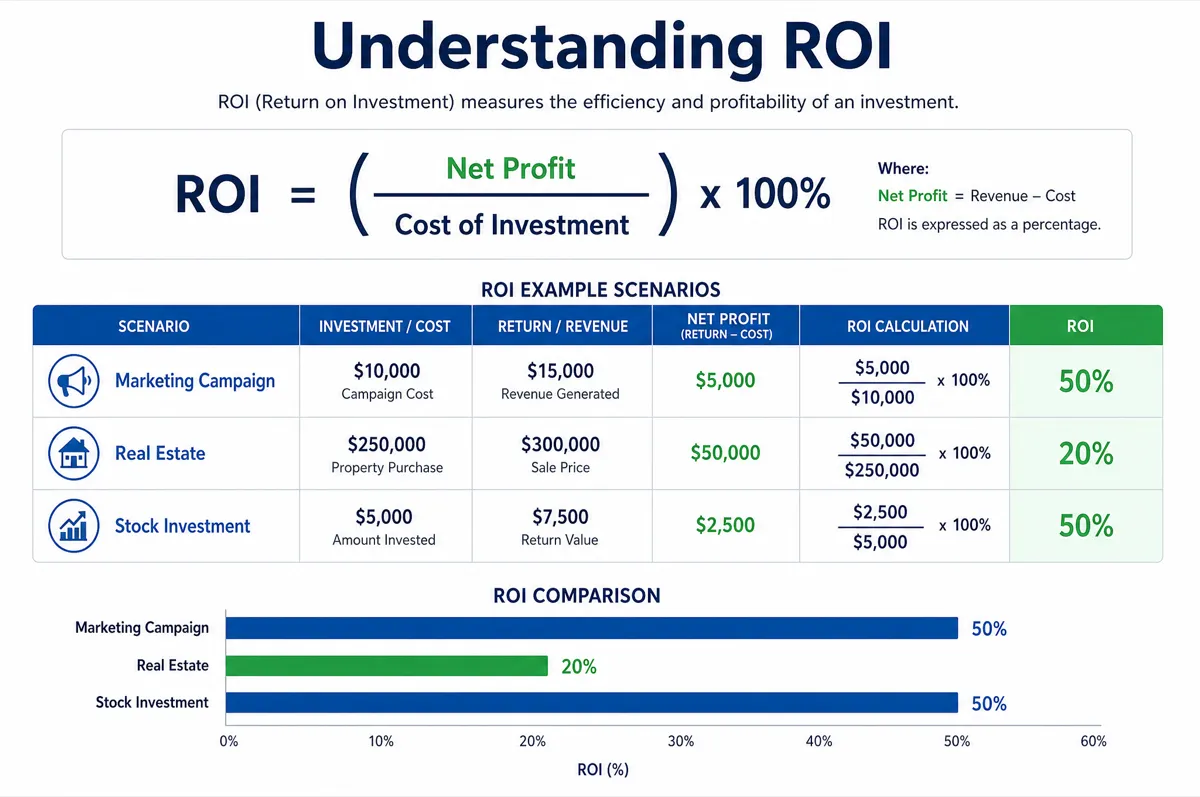
How ROI Works
Return on Investment (ROI) measures the profitability of an investment relative to its cost. The core formula is straightforward: subtract the total cost from the total gain, divide by the total cost, and multiply by 100 to express it as a percentage. An ROI of 50% means you earned $0.50 for every dollar invested. An ROI of -20% means you lost 20 cents on every dollar.
What makes ROI powerful is its universality. Unlike metrics tied to specific asset classes, ROI applies equally to a $500 marketing test, a $200,000 rental property, or a $10,000 stock portfolio. This lets you compare fundamentally different opportunities on the same scale. A marketing campaign returning 120% ROI in 6 months is objectively more profitable than a rental property returning 8% annually, even though the dollar amounts differ by orders of magnitude.
The critical nuance most people miss is time. A 50% ROI earned over 5 years is far less impressive than 50% earned in 6 months. This is why annualized ROI matters for any investment held longer than one year. To annualize, use the formula: (1 + ROI)^(1/years) - 1. A 50% total return over 5 years translates to approximately 8.4% annualized, which is roughly in line with historical stock market returns. Use our Compound Interest Calculator to see how annualized returns compound over longer horizons.
ROI vs. Other Return Metrics
ROI is not the only way to evaluate an investment. Each metric answers a slightly different question. The table below compares the most common return metrics, when to use each, and their limitations.
| Metric | Formula | Best For | Limitation |
|---|---|---|---|
| ROI | (Gain - Cost) / Cost | Quick profitability check | Ignores time and risk |
| CAGR | (End/Start)^(1/n) - 1 | Multi-year investments | Hides volatility |
| IRR | NPV = 0 discount rate | Uneven cash flows | Complex to calculate |
| Payback Period | Cost / Annual Cash Flow | Liquidity-focused decisions | Ignores returns after payback |
| Cap Rate | NOI / Property Value | Real estate comparison | Ignores financing and appreciation |
For most personal finance decisions, ROI combined with annualized ROI gives you 80% of the insight you need. Use our Investment Return Calculator to calculate CAGR for portfolio investments where you know the starting and ending values.
Case Study: Sarah's Small Business Equipment Purchase
Sarah runs a bakery in Portland, OR, producing 200 custom cakes per month at an average price of $65. She is considering purchasing a commercial stand mixer and automated decorating station for $18,000. The equipment would reduce labor costs by $1,200 per month and allow her to increase output by 40 cakes per month, generating an additional $2,600 in revenue.
Her total annual gain from the equipment is ($1,200 + $2,600) x 12 = $45,600 in additional revenue and savings. The equipment has annual maintenance costs of $2,400, making the ongoing annual cost $2,400. In year one, the total cost is $18,000 + $2,400 = $20,400, and the net profit is $45,600 - $20,400 = $25,200. The first-year ROI is $25,200 / $20,400 = 123.5%.
The payback period is even more telling: $18,000 / ($45,600 - $2,400) = 0.42 years, or approximately 5 months. After the payback period, every dollar of incremental revenue flows directly to profit. Over a 5-year equipment lifespan, Sarah's total ROI is ($45,600 x 5 - $18,000 - $2,400 x 5) / ($18,000 + $2,400 x 5) = 630%, with an annualized ROI of approximately 48.7%. This analysis gave Sarah the confidence to finance the equipment, knowing it would generate significant returns well above her 9% loan interest rate.
ROI by Investment Category
Different asset classes deliver dramatically different ROI profiles. The table below shows historical average annual ROI ranges for common investment categories, along with typical holding periods and risk levels.
| Category | Avg Annual ROI | Typical Horizon | Risk Level |
|---|---|---|---|
| S&P 500 Index | 10-11% | 10+ years | Moderate |
| Rental Real Estate | 8-12% | 5-30 years | Moderate-High |
| Small Business | 15-30% | 3-10 years | High |
| Bonds (Aggregate) | 4-6% | 1-10 years | Low |
| High-Yield Savings | 4-5% | Any | Very Low |
| Marketing Campaigns | 50-500% | 1-12 months | Variable |
These figures represent broad averages. Individual results vary enormously based on timing, location, execution, and market conditions. The S&P 500 returned -18.1% in 2022 and +26.3% in 2023 — the annual average only materializes over multi-decade holding periods. Build a diversified portfolio and track your actual returns with our Investment Return Calculator to compare against these benchmarks.
How to Improve Your ROI
ROI has only two levers: increase returns or reduce costs. Here are specific strategies organized by investment type.
For business investments: Track ROI at the campaign or project level, not just company-wide. A business with 20% overall ROI may have one product line delivering 80% ROI and another losing money. Identifying which initiatives drive returns lets you reallocate capital from low-ROI activities to high-ROI ones. Common high-ROI business investments include automation tools that reduce labor costs, employee training that increases productivity, and customer retention programs that reduce acquisition costs.
For portfolio investments: Minimize fees, which directly reduce ROI. An index fund charging 0.03% annually versus an actively managed fund charging 1.2% creates a 1.17% annual drag. Over 30 years on a $100,000 portfolio growing at 10%, that fee difference costs $207,000 in lost returns. Tax-loss harvesting, asset location (placing high-growth assets in Roth accounts), and avoiding unnecessary trading all improve after-tax ROI. Plan your tax strategy with our 401(k) vs Roth IRA guide to maximize after-tax returns.
For real estate: ROI improves with leverage, but risk increases proportionally. A $200,000 property generating $24,000 in annual rent with $8,000 in expenses delivers 8% ROI on a cash purchase. With a 20% down payment ($40,000) and a mortgage, the same cash flow applies to a $40,000 investment, boosting cash-on-cash ROI to 40%, though mortgage payments reduce the net figure. Factor in appreciation, tax benefits, and vacancy rates for a complete picture.
Common ROI Mistakes to Avoid
The simplicity of the ROI formula creates blind spots that lead to poor decisions. Ignoring opportunity cost is the most common error: a 15% ROI from a rental property sounds attractive until you realize the same capital in an S&P 500 index fund would have returned 11% with zero management effort. The true ROI of any investment should be measured against the next best alternative.
Second, most people calculate ROI on gross returns without subtracting taxes. A stock investment returning 50% over 3 years faces capital gains tax of 15-20% on the profit, reducing the after-tax ROI to 40-42.5%. Real estate investors benefit from depreciation deductions and 1031 exchanges that defer taxes, effectively boosting after-tax ROI. Always compare investments on an after-tax basis for an accurate picture. Track your overall financial position with our beginner investing guide to build good ROI-tracking habits from the start.
Frequently Asked Questions
What is a good ROI percentage?
A "good" ROI depends entirely on the investment type and risk level. For stock market investments, 7-10% annually (after inflation) is considered strong based on historical S&P 500 returns. For business investments, anything above 15-20% annually is generally worthwhile. For marketing campaigns, a minimum ROI of 500% (5:1 ratio) is the standard benchmark for paid advertising. Any ROI above 0% means you earned more than you spent, but you should always compare against the risk-free rate (currently around 4.5% via Treasury bonds) to determine if the extra risk was worth it.
Does ROI account for inflation?
The basic ROI formula uses nominal (non-inflation-adjusted) figures. To calculate real ROI, subtract the inflation rate from your nominal ROI. If your investment returned 12% and inflation was 3%, your real ROI is approximately 9%. For long-term investments spanning 5+ years, real ROI is the only meaningful metric because inflation can erode half or more of nominal gains over multi-decade periods. Use 3% as a baseline inflation assumption for most planning purposes.
How is ROI different from profit margin?
Profit margin measures what percentage of revenue is profit (profit / revenue), while ROI measures what percentage return you earned on your investment (profit / investment cost). A business with a 10% profit margin and $1,000,000 in revenue earns $100,000 in profit. If the owner invested $200,000 to build the business, the ROI is 50%. Both metrics are useful but answer different questions: margin tells you about operational efficiency, while ROI tells you about capital efficiency.
Can ROI be negative?
Yes. A negative ROI means you lost money on the investment. If you invested $10,000 and received back $8,000, your ROI is -20%. Negative ROI is common in early-stage businesses that have not yet generated sufficient revenue to cover initial investment costs. In the stock market, individual years frequently produce negative ROI (the S&P 500 has declined in roughly 25% of calendar years since 1928), which is why long holding periods are essential for equity investors.
Should I include my time as a cost in ROI calculations?
For side businesses, freelance projects, and active real estate management, including an hourly rate for your time provides a more accurate ROI. If you spent 200 hours managing a rental property and value your time at $50/hour, that is $10,000 in implicit cost that should be added to the investment cost. Without accounting for time, a rental property showing 15% ROI might actually deliver only 5% when your labor is factored in. Passive investments like index funds require virtually zero time, which is a significant advantage in true risk-adjusted ROI comparisons.