Guides / Investment Analysis
How to Calculate ROI: Formula, Examples, and Common Mistakes
Return on investment (ROI) is the most widely used metric for evaluating whether an investment, project, or business decision was worth the money. This guide walks through the exact formula, five real-world calculations across different asset classes, the annualized ROI method for comparing investments over different time periods, and the most common mistakes that lead to inflated or misleading ROI figures.
Last updated: September 2026
TL;DR - Quick Answer
- Basic formula: ROI = (Net Profit / Investment Cost) x 100
- Example: Invest $10,000, receive $15,000 back. Net profit = $5,000. ROI = ($5,000 / $10,000) x 100 = 50%
- Annualized formula: Annualized ROI = ((1 + Total ROI)^(1/years)) - 1, which adjusts for holding period
- Common mistake: Ignoring ongoing costs (taxes, maintenance, fees) inflates ROI by 20-40% on average
Run your own numbers with our ROI Calculator for instant results.
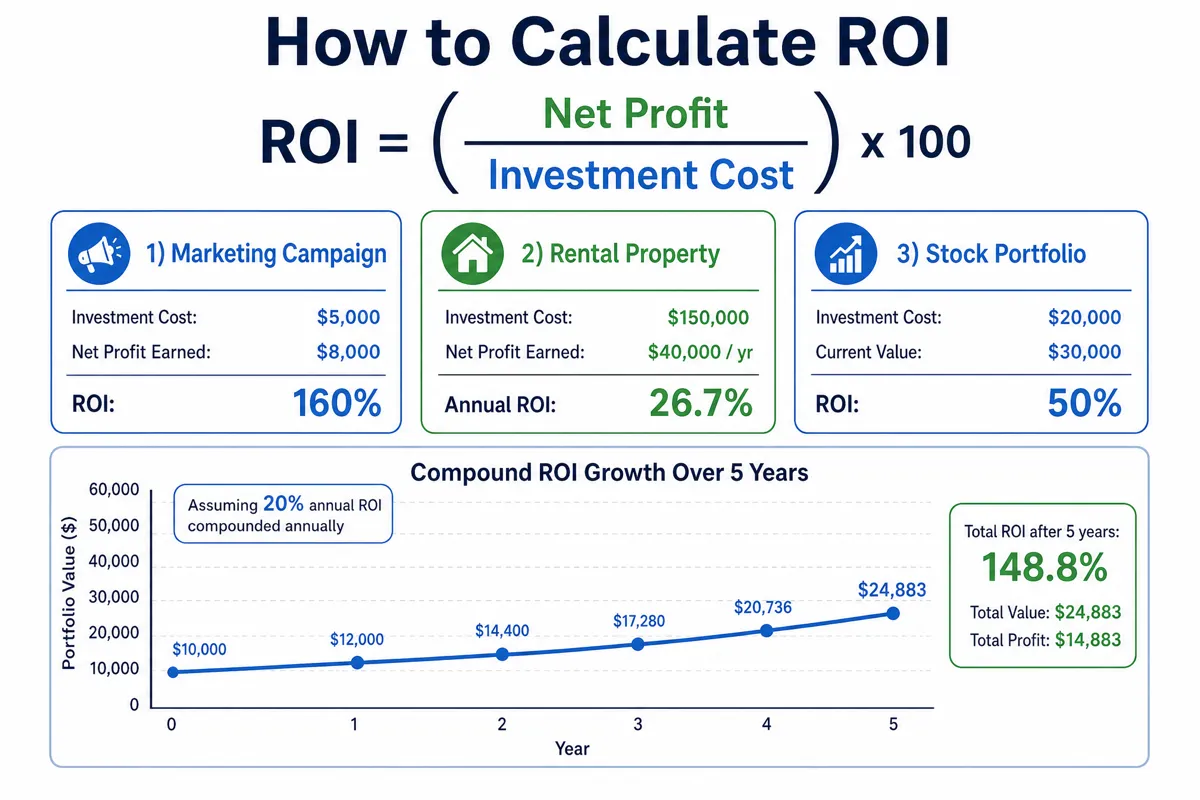
The ROI Formula Explained
Return on investment measures the gain or loss generated relative to the amount invested. The basic formula is straightforward:
ROI = (Net Profit / Investment Cost) x 100
Where Net Profit = Total Returns - Investment Cost - Ongoing Costs
The result is expressed as a percentage. A positive ROI means the investment earned more than it cost; a negative ROI means it lost money. Simple as the formula appears, the challenge lies in correctly defining "net profit" and "investment cost." Most ROI errors come from incomplete accounting of costs -- forgetting taxes, fees, maintenance, opportunity cost, or the time value of money.
For investments held over multiple years, the basic formula fails to account for time. A 50% return over 1 year is dramatically better than 50% over 10 years, yet simple ROI treats them identically. That is where annualized ROI comes in:
Annualized ROI = ((1 + Total ROI)^(1/years)) - 1
Converts total return to an equivalent annual rate for apples-to-apples comparison
Use our ROI Calculator to compute both simple and annualized ROI instantly, including ongoing costs and multi-year revenue projections. For compound growth scenarios, pair it with the Compound Interest Calculator to model how reinvested returns accelerate wealth building.
5 Real-World ROI Calculations
1. Marketing Campaign ROI
A small e-commerce business spends $5,000 on a Facebook ad campaign over 3 months. The campaign generates $18,000 in attributable revenue. The cost of goods sold on those orders is $7,200 (40% margin).
- Gross revenue: $18,000
- COGS: $7,200
- Gross profit: $10,800
- Ad spend: $5,000
- Net profit: $10,800 - $5,000 = $5,800
- ROI: ($5,800 / $5,000) x 100 = 116%
Many marketers calculate ROI using gross revenue instead of gross profit, which would show ($18,000 - $5,000) / $5,000 = 260%. That is misleading because it ignores the cost of fulfilling those orders. Always use net profit for an accurate picture.
2. Rental Property ROI
A real estate investor purchases a $300,000 rental property with $60,000 down (20%) and $4,000 in closing costs. The mortgage payment is $1,556/month. Annual rental income is $24,000 ($2,000/month). Annual expenses beyond the mortgage include $3,600 in property taxes, $1,500 in insurance, $2,400 in maintenance, and $1,200 for vacancy allowance (5%).
- Total cash invested: $64,000
- Annual revenue: $24,000
- Annual mortgage: $18,672
- Annual operating costs: $8,700
- Net annual cash flow: $24,000 - $18,672 - $8,700 = -$3,372
- Cash-on-cash ROI: (-$3,372 / $64,000) x 100 = -5.3%
This is a negative cash-on-cash ROI in year one, which is common when including the full mortgage payment. However, the ROI picture improves when factoring in equity buildup (approximately $5,400/year in principal paydown) and potential 3-4% annual appreciation. The total ROI including equity and appreciation is closer to 10-14% annually, but the cash-flow-only measure reveals that this property requires out-of-pocket support each month.
3. Stock Portfolio ROI
An investor buys $50,000 worth of an S&P 500 index fund (VOO) and holds it for 3 years. The portfolio grows to $62,500 after dividends are reinvested. Trading commissions are $0 (most brokers charge no commission). The fund's expense ratio of 0.03% costs roughly $50 over the period.
- Total return: $62,500 - $50,000 = $12,500
- Net profit: $12,500 - $50 (fees) = $12,450
- Simple ROI: ($12,450 / $50,000) x 100 = 24.9%
- Annualized ROI: ((1 + 0.249)^(1/3)) - 1 = 7.7%
The 7.7% annualized return is slightly below the S&P 500 long-term average of ~10%, reflecting a moderate growth period. Note that this is pre-tax: long-term capital gains tax (0%, 15%, or 20% depending on income) would reduce the effective return. For detailed investment growth projections, use our Investment Return Calculator.
4. Business Equipment ROI
A bakery invests $50,000 in a commercial convection oven that increases production capacity by 40%. The additional capacity generates $30,000/year in incremental revenue with $12,000/year in additional ingredient and labor costs. The oven has a 10-year useful life and $2,000 in annual maintenance.
- Annual net profit: $30,000 - $12,000 - $2,000 = $16,000
- 5-year net profit: $80,000
- 5-year ROI: ($80,000 / $50,000) x 100 = 160%
- Annualized ROI: ((1 + 1.6)^(1/5)) - 1 = 21.1%
- Payback period: $50,000 / $16,000 = 3.1 years
A 3.1-year payback period with 21.1% annualized ROI is excellent for a capital equipment investment. The oven continues generating $16,000/year in profit for the remaining 7 years of its life, making the full 10-year ROI significantly higher.
5. Education ROI
A professional spends $25,000 on an MBA program (part-time, 2 years) while continuing to work. After completing the degree, their salary increases from $65,000 to $85,000 -- a $20,000 annual raise. Opportunity cost: $3,000/year in reduced free time valued at consulting rates.
- Investment: $25,000 tuition + $6,000 opportunity cost = $31,000
- Annual salary increase: $20,000
- 5-year cumulative gain: $100,000
- 5-year net profit: $100,000 - $31,000 = $69,000
- 5-year ROI: ($69,000 / $31,000) x 100 = 222.6%
- Annualized ROI (from graduation): ((1 + 2.226)^(1/5)) - 1 = 26.4%
Education ROI compounds over a career: the $20,000 raise persists for 20-30 working years, making the true lifetime ROI far higher. However, this example does not account for the tax impact on the higher salary or potential raises the professional might have received without the degree.
ROI Comparison Across Investment Types
| Investment Type | Investment | Time | Net Profit | Simple ROI | Annualized ROI |
|---|---|---|---|---|---|
| Marketing Campaign | $5,000 | 3 months | $5,800 | 116% | ~560%* |
| Rental Property (cash flow) | $64,000 | 1 year | -$3,372 | -5.3% | -5.3% |
| S&P 500 Index Fund | $50,000 | 3 years | $12,450 | 24.9% | 7.7% |
| Business Equipment | $50,000 | 5 years | $80,000 | 160% | 21.1% |
| MBA Education | $31,000 | 5 years | $69,000 | 222.6% | 26.4% |
*Marketing campaign annualized ROI is extrapolated from a 3-month period and is not sustainable at scale.
This table demonstrates why annualized ROI is essential for comparison. The marketing campaign has the highest simple ROI (116%) but operates over just 3 months. The education investment shows the highest annualized ROI (26.4%) with a long payback horizon that compounds over an entire career.
Case Study: David Evaluates Three Investment Opportunities
David is a 35-year-old small business owner in Phoenix with $50,000 to invest. He is comparing three options: expanding his business (new equipment), a rental property down payment, and investing in an S&P 500 index fund. He uses ROI analysis to make a data-driven decision.
Option A: Business expansion.A $50,000 commercial pizza oven increases his restaurant's capacity by 35%. He estimates $28,000/year in additional revenue with $10,000 in additional costs (ingredients, labor, utilities), yielding $18,000/year net. Over 5 years: ROI = ($90,000 / $50,000) x 100 = 180%. Annualized: 22.9%.
Option B: Rental property. He uses the $50,000 as a down payment on a $250,000 condo. After mortgage, taxes, insurance, and maintenance, net annual cash flow is $2,400. Cash-on-cash ROI: ($2,400 / $54,000) x 100 = 4.4%. Including 3% appreciation and equity buildup, total annualized ROI is approximately 11%.
Option C: Index fund. Historical average return of 10% annually. After 5 years, $50,000 grows to approximately $80,525. Annualized ROI: 10%. Fully passive with no management effort.
David chooses Option A. The 22.9% annualized ROI is more than double the index fund return, and the investment directly strengthens his primary income source. He accepts the higher risk (his business must sustain the increased demand) in exchange for the higher return. He uses our ROI Calculator to model sensitivity: even if revenue growth is only 25% of projections ($7,000/year net instead of $18,000), the 5-year ROI is still -30% -- meaning he loses money. This downside scenario helps him set a minimum revenue target to monitor monthly.
5 Common Mistakes That Inflate ROI
- 1. Forgetting ongoing costs. A rental property ROI calculated with only the down payment and gross rent ignores mortgage payments, taxes, insurance, maintenance, and vacancy. This can inflate ROI from the realistic 4-12% range to an unrealistic 25-40%.
- 2. Ignoring the time dimension.Reporting "200% ROI" without specifying whether it took 1 year or 10 years makes the number meaningless. Always calculate and report annualized ROI alongside simple ROI.
- 3. Using revenue instead of profit. Marketing ROI is especially prone to this error. An ad campaign that generates $50,000 in revenue on $10,000 in ad spend looks like 400% ROI, but if the product margin is 30%, the actual profit-based ROI is ($15,000 - $10,000) / $10,000 = 50%.
- 4. Excluding opportunity cost. Money invested in one asset cannot simultaneously earn returns elsewhere. If your business investment returns 8% but a risk-free Treasury bond pays 5%, your excess return is only 3%. Compare every ROI against what the money would have earned in the next-best alternative.
- 5. Ignoring taxes. A stock sold for 25% profit owes 15% long-term capital gains tax in most brackets, reducing the after-tax ROI to 21.25%. Real estate investors face depreciation recapture at 25%. Always factor in tax impact for accurate after-tax ROI.
Step-by-Step: How to Calculate ROI for Any Investment
- Identify total investment cost. Include the purchase price, transaction fees, setup costs, and any opportunity cost of capital. For a business: equipment + installation + training. For real estate: down payment + closing costs + initial repairs.
- Calculate ongoing costs. List all recurring expenses tied to the investment: maintenance, management fees, taxes, insurance, subscription costs. Sum these over your evaluation period.
- Measure total returns. Track all revenue, dividends, rental income, cost savings, or resale value generated by the investment. Use actual numbers, not projections, whenever possible.
- Compute net profit. Total returns minus investment cost minus ongoing costs = net profit. This must be a single, honest number.
- Apply the ROI formula. (Net Profit / Investment Cost) x 100 for simple ROI. Use the annualized formula if the holding period exceeds one year.
- Compare against alternatives. Stack your ROI against the risk-free rate, market index returns, and other available investments to determine if the return justified the risk.
For an instant calculation with ongoing costs and multi-year projections built in, use our ROI Calculator. For comparing how compound growth changes your returns over time, try the Compound Interest Calculator.
Run Your Own Numbers
Use our free calculator to see ROI for your specific investment scenario.
Open ROI CalculatorFAQ
What is a good ROI percentage?
There is no universal 'good' ROI because it depends on the asset class, time horizon, and risk. The S&P 500 has averaged roughly 10% annualized return before inflation (7% after inflation) over the past 50 years. For business investments, most companies target at least 15-25% ROI to justify the capital and risk. Real estate rental properties commonly target 8-12% cash-on-cash return. Marketing campaigns often aim for 300-500% ROI. Always compare ROI against the risk-free rate (currently ~5% from Treasury bonds) as your baseline.
What is the difference between ROI and annualized ROI?
Simple ROI shows total return regardless of time: a $10,000 investment that earns $5,000 over 5 years has a 50% ROI. Annualized ROI adjusts for time using the formula: Annualized ROI = ((1 + Total ROI)^(1/years)) - 1. That same 50% total return over 5 years equals approximately 8.45% annualized ROI. Annualized ROI lets you compare investments with different holding periods on equal footing -- a 30% return over 1 year is far better than 50% over 5 years.
Does ROI account for inflation?
The standard ROI formula does not adjust for inflation. To calculate real (inflation-adjusted) ROI, use: Real ROI = ((1 + Nominal ROI) / (1 + Inflation Rate)) - 1. For example, a nominal 10% ROI with 3% inflation yields a real ROI of approximately 6.8%. Over long holding periods, ignoring inflation can make investments look significantly more profitable than they actually are in purchasing power terms.
How do I calculate ROI on rental property?
For rental property, use cash-on-cash ROI: (Annual Net Cash Flow / Total Cash Invested) x 100. Total cash invested includes down payment, closing costs, and initial repairs. Annual net cash flow is rental income minus mortgage payments, property taxes, insurance, maintenance, and vacancy costs. On a $300,000 property with $60,000 down and $4,000 in closing costs, earning $24,000/year in rent with $16,000 in total expenses (including mortgage), your cash-on-cash ROI is ($8,000 / $64,000) x 100 = 12.5%.
Can ROI be negative?
Yes. A negative ROI means the investment lost money. If you invest $10,000 and receive back only $8,000, your ROI is -20%. Negative ROI is common in business startups (many are unprofitable initially), failed marketing campaigns, and investments sold at a loss. Tracking negative ROI is just as important as tracking positive returns -- it helps identify underperforming assets that should be cut or restructured.
Related Guides
How to Start Investing with $1,000: A Beginner's Step-by-Step Guide
Start investing with just $1,000. Learn which account to open, what to buy (VTI, VOO, VTSAX), and how $100/month grows to six figures over time.
Compound Interest: 5 Real-Life Examples That Show Its Power
See compound interest in action with 5 real examples: $500/month for 40 years, credit card debt traps, student loans, and the Rule of 72 explained.
Student Loan Repayment: 7 Strategies to Pay Off Debt Faster in 2026
Learn 7 proven student loan repayment strategies with real numbers on a $40,000 balance. Compare standard repayment, IDR, refinancing, PSLF, and accelerated payoff methods.