How Dividends Work
A dividend is a portion of a company's earnings distributed to shareholders, typically on a quarterly basis. When a company earns profits beyond what it needs for reinvestment and operations, the board of directors can vote to return some of that cash to shareholders. Dividends are usually expressed as a dollar amount per share: if a company pays $2.00 annually and you own 100 shares, you receive $200 per year in dividend income.
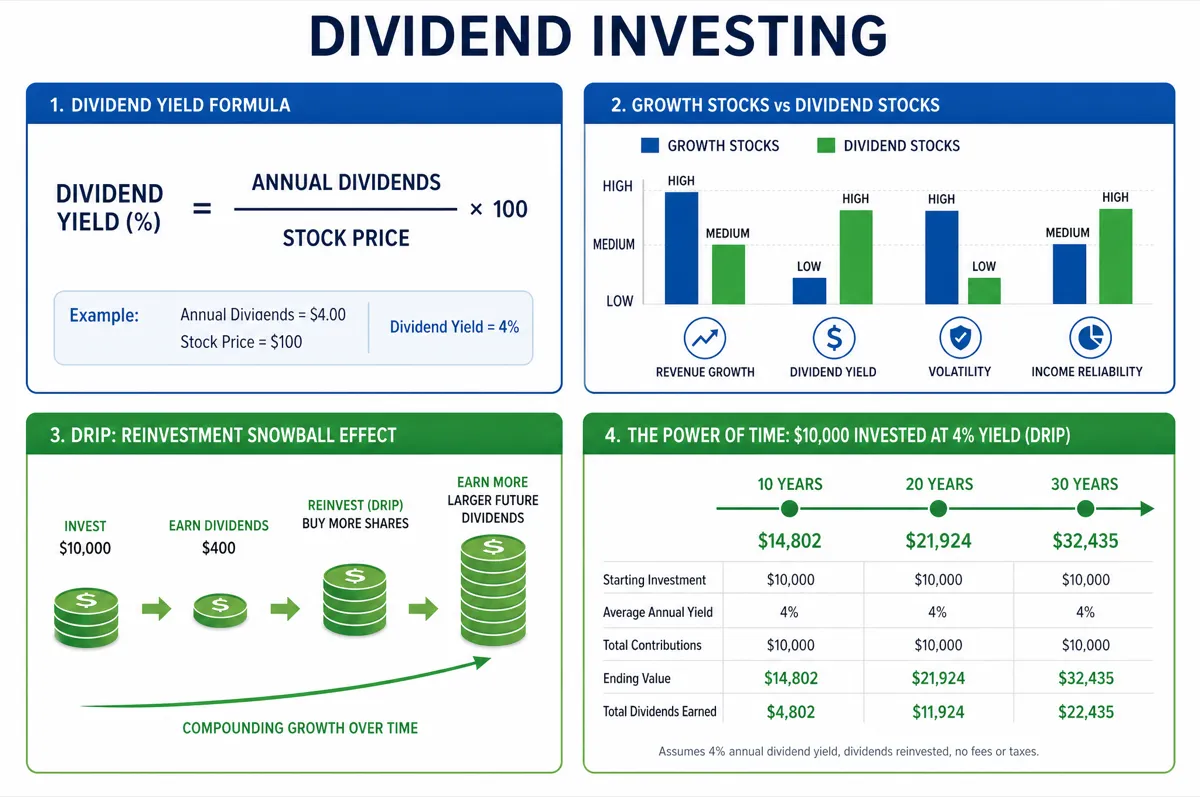
The dividend yield — calculated by dividing the annual dividend per share by the current share price — is the metric investors use to compare income across different stocks. A stock trading at $50 that pays $2.00 annually has a 4.0% yield. That same $2.00 dividend on a stock trading at $100 produces only a 2.0% yield. Yield fluctuates daily as the share price moves, which is why a rising stock price can actually reduce your yield even if dividends stay constant. Tracking your total returns over time with our Investment Return Calculator helps separate price appreciation from dividend income in your portfolio.
Dividend Yield vs. Dividend Growth
Investors broadly fall into two camps: those who prioritize high current yield and those who prioritize dividend growth. High-yield stocks (utilities, REITs, tobacco companies) often pay 5% to 8% but grow dividends slowly at 1% to 3% per year. Dividend growth stocks (technology, healthcare, consumer staples aristocrats) might yield only 1.5% to 3% initially but raise their dividends 8% to 15% annually.
The math reveals a critical crossover point. A stock yielding 2.0% with 10% annual dividend growth will surpass the income from a 5.0% yielder growing at 2% in approximately year 10. By year 20, the growth stock produces nearly three times the annual income. This is why many long-term investors prefer growth: the income starts smaller but compounds aggressively. The effect mirrors the principles behind compound interest, where time transforms modest growth rates into powerful wealth accumulation.
The Power of DRIP (Dividend Reinvestment)
A Dividend Reinvestment Plan (DRIP) automatically uses your dividend payments to purchase additional shares of the same stock. Instead of receiving $200 in cash, you receive 4 additional shares at $50 each. Those 4 new shares then generate their own dividends, which buy more shares, which generate more dividends — creating a compounding snowball effect.
DRIP is most powerful over long time horizons. Consider an investor who buys $10,000 worth of a stock yielding 3.5% with 6% annual dividend growth and 7% share price appreciation. Without DRIP, after 25 years the portfolio is worth approximately $54,274 with $2,940 in annual dividends. With DRIP, the portfolio grows to roughly $82,600 and annual dividends reach $5,330 — a 55% larger portfolio and 81% more income, purely from reinvesting rather than spending dividends.
Case Study: Marcus Builds a Dividend Income Stream
Marcus is 30 years old and wants to build a portfolio that generates $24,000 per year ($2,000 per month) in dividend income by age 55. He starts with $15,000 and can invest $400 per month. He builds a diversified portfolio of dividend growth stocks and ETFs with an average yield of 3.0%, average dividend growth of 7%, and average share price appreciation of 8% per year.
In year 1, Marcus owns roughly $19,800 in stocks (initial investment plus contributions) generating about $594 in annual dividends. He enables DRIP across all holdings. By year 10, his portfolio has grown to approximately $102,000 and dividends reach $3,700 annually. The snowball accelerates: by year 15, his portfolio crosses $210,000 with $8,900 in annual dividends. By year 20, his portfolio reaches $415,000 generating $19,500 annually. At year 25, Marcus hits his goal: the portfolio is worth approximately $790,000 and throws off $26,400 in annual dividends — exceeding his $24,000 target by $2,400.
The critical insight from Marcus's journey: only $135,000 of his $790,000 portfolio came from his own contributions. The remaining $655,000 was generated by capital appreciation and reinvested dividends. Starting early and staying consistent let compounding do the heavy lifting. For a broader perspective on retirement income planning, explore our ROI Calculator to compare dividend investing against other income-generating strategies.
High Yield vs. Growth: 25-Year Comparison
| Metric | High Yield (5%, 2% Growth) | Dividend Growth (2.5%, 10% Growth) |
|---|---|---|
| Year 1 Income | $500 | $250 |
| Year 10 Income | $597 | $648 |
| Year 20 Income | $728 | $1,682 |
| Year 25 Income | $804 | $2,710 |
| Total Dividends (25 yr) | $16,406 | $22,159 |
| Crossover Point | Year 8 (growth income surpasses high yield) | |
This comparison assumes a $10,000 initial investment with no additional contributions and no DRIP. The dividend growth portfolio generates 35% more total income over 25 years despite starting at half the yield. With DRIP enabled, the gap widens further because growth stocks reinvest at a faster-accelerating rate.
Building a Dividend Portfolio: Practical Tips
- Diversify across sectors: Holding dividend stocks in utilities, healthcare, consumer staples, financials, and REITs protects you from sector-specific cuts. If one industry slashes dividends, others likely continue paying.
- Focus on payout ratio: A company paying 40% to 60% of earnings as dividends is sustainable. Above 80% signals the dividend may be at risk during a downturn. Below 30% suggests room for future increases.
- Use dividend ETFs for simplicity: Funds like VYM (Vanguard High Dividend Yield), SCHD (Schwab U.S. Dividend Equity), and DGRO (iShares Core Dividend Growth) provide instant diversification across 200+ dividend payers for expense ratios under 0.10%.
- Track yield on cost, not current yield: Yield on cost measures your dividend income relative to what you actually paid. A stock bought at $40 now paying $3.20 yields 8.0% on cost even if current yield is only 3.5%. This metric reveals the real power of holding quality dividend growers.
- Reinvest in tax-advantaged accounts: Hold dividend stocks in IRAs or 401(k)s when possible to avoid annual tax drag. Qualified dividends in taxable accounts are taxed at 0% to 20% depending on income, but tax deferral still accelerates compounding. Compare account options using our beginner investing guide.
Dividend Aristocrats and Kings
Dividend Aristocrats are S&P 500 companies that have raised their dividend for at least 25 consecutive years. Dividend Kings have done so for 50+ years. These companies — including Johnson & Johnson, Procter & Gamble, Coca-Cola, and 3M — have demonstrated resilience through recessions, market crashes, and industry disruptions. While past performance does not guarantee future results, a 25-year track record of increasing payouts is a strong signal of financial discipline and shareholder commitment.
Investors building a dividend income stream often anchor their portfolio with 5 to 10 Aristocrats or Kings, then supplement with higher-growth dividend payers for acceleration. This barbell approach balances reliability with growth potential. Read more about building a diversified foundation in our compound interest examples guide.
FAQ
How often are dividends paid?
Most U.S. companies pay dividends quarterly (four times per year). Some REITs and international stocks pay monthly. A few companies pay semi-annually or annually. You can build a monthly income stream by holding stocks with staggered payment schedules — for example, one stock paying in January/April/July/October and another paying in February/May/August/November.
What is a good dividend yield?
For U.S. large-cap stocks, 2.0% to 4.0% is typical for established dividend payers. Below 2.0% often indicates a growth company with a small payout. Above 6.0% may signal an unsustainable payout or a falling stock price (which inflates the yield calculation). The S&P 500 average yield has historically ranged from 1.5% to 2.5%.
Are dividends taxed?
Qualified dividends (from stocks held more than 60 days) are taxed at long-term capital gains rates: 0% for income up to $47,025 (single filers in 2026), 15% for most taxpayers, and 20% for high earners above $518,900. Non-qualified (ordinary) dividends are taxed at your regular income tax rate. Holding dividend stocks in tax-advantaged accounts like IRAs eliminates annual tax drag entirely.
Should I reinvest dividends or take cash?
If you are in the accumulation phase (building wealth for future goals), reinvesting via DRIP maximizes compounding and is almost always the better choice. If you are in the distribution phase (relying on portfolio income for living expenses), taking cash makes sense. The calculator above lets you model both scenarios to see the long-term impact.
What happens if a company cuts its dividend?
A dividend cut reduces your income from that holding and usually causes the stock price to drop 10% to 30% on the announcement. Diversification is your primary protection: if one of 20 holdings cuts its dividend, you lose roughly 5% of portfolio income rather than a catastrophic amount. Monitor payout ratios and earnings trends to identify at-risk dividends before cuts happen.