What Is Profit Margin?
Profit margin measures how much of every dollar of revenue a business keeps as profit after paying its costs. It is expressed as a percentage and is one of the most widely used indicators of financial health. A company with $100,000 in revenue and $24,000 in net profit has a 24% net profit margin, meaning it retains $0.24 from every dollar earned. Investors, lenders, and business owners all rely on profit margin to evaluate whether a company is pricing its products correctly, controlling costs effectively, and generating sustainable returns.
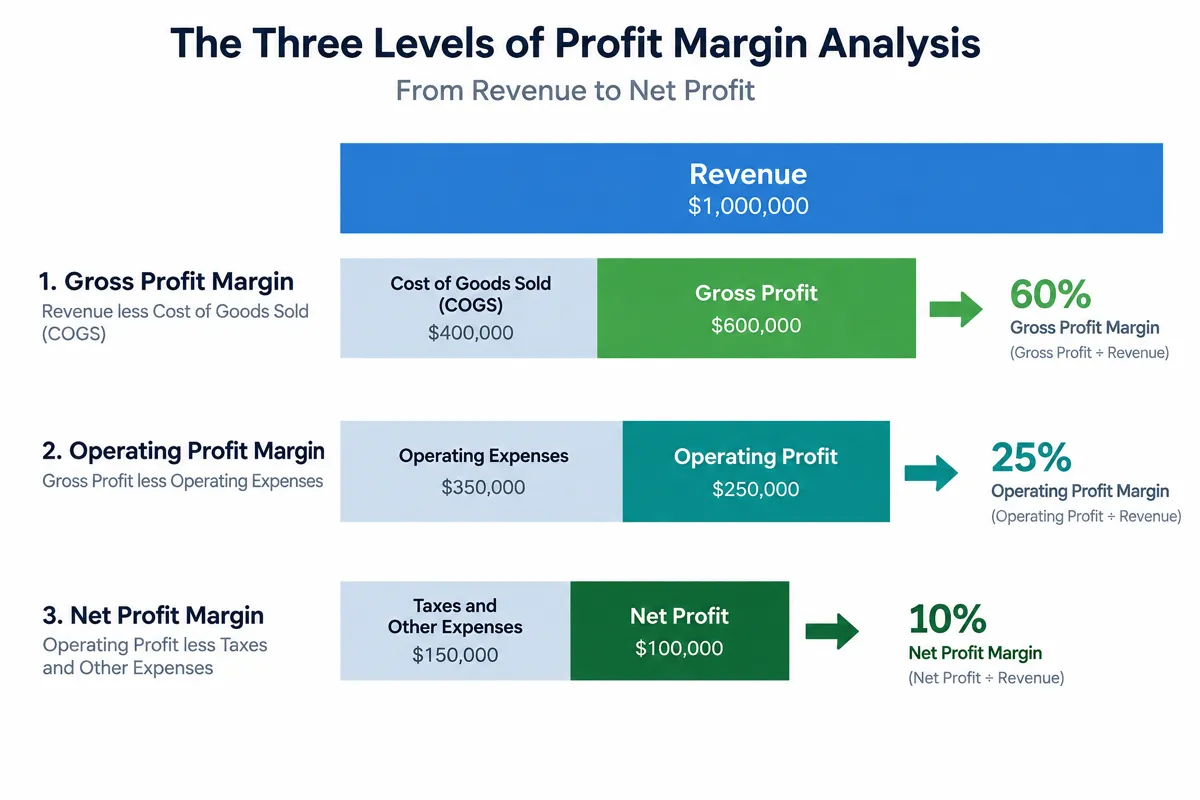
There are three levels of profit margin, each revealing a different layer of business performance. Gross profit margin shows how efficiently a company produces or acquires its goods. Operating profit margin reflects how well it manages day-to-day overhead beyond production. Net profit margin captures the final bottom-line percentage after every expense, including taxes and interest, has been paid. Analyzing all three together gives a complete picture of where money is being made and where it is leaking out. Understanding these distinctions is essential for making informed decisions about pricing, cost-cutting, and growth investment.
How Profit Margins Are Calculated
Gross Profit Margin = (Revenue - Cost of Goods Sold) / Revenue x 100. This formula isolates production efficiency. If a furniture maker generates $200,000 in annual revenue and spends $80,000 on lumber, hardware, and direct labor, the gross profit is $120,000 and the gross margin is 60%. A high gross margin means the core product or service is priced well above its direct costs, leaving room to cover overhead and generate profit.
Operating Profit Margin = (Revenue - COGS - Operating Expenses) / Revenue x 100. Operating expenses include rent, utilities, marketing, administrative salaries, and software subscriptions -- costs necessary to run the business but not directly tied to producing each unit. Using the furniture maker example, if operating expenses total $70,000, operating profit is $50,000 and the operating margin is 25%. This tells you how much the business earns from its core operations before financing costs and taxes.
Net Profit Margin = (Revenue - All Expenses) / Revenue x 100. The net margin subtracts everything: COGS, operating expenses, interest on debt, depreciation, and income taxes. If the furniture maker pays $8,000 in loan interest and $10,500 in taxes, net profit is $31,500 and the net margin is 15.75%. This is the definitive profitability metric -- the percentage of revenue that actually stays in the business as retained earnings.
When evaluating your margins, it helps to compare them against the return on specific investments you have made in the business. Use our ROI Calculator to measure whether capital expenditures, marketing campaigns, or new hires are delivering returns that justify their impact on your margins.
Margin vs. Markup: Understanding the Difference
Margin and markup are related but measure different things, and confusing them is one of the most common pricing mistakes. Margin is profit as a percentage of revenue (the selling price). Markup is profit as a percentage of cost. A product that costs $60 to produce and sells for $100 has a 40% profit margin ($40 / $100) but a 66.7% markup ($40 / $60). The same dollar amount of profit produces a very different percentage depending on which denominator you use. Businesses that set prices using markup targets should always verify the resulting margin to ensure overall profitability targets are met.
| Cost | Price | Profit | Margin | Markup |
|---|---|---|---|---|
| $40 | $100 | $60 | 60.00% | 150.00% |
| $50 | $100 | $50 | 50.00% | 100.00% |
| $60 | $100 | $40 | 40.00% | 66.67% |
| $75 | $100 | $25 | 25.00% | 33.33% |
| $90 | $100 | $10 | 10.00% | 11.11% |
Notice how margin and markup diverge more dramatically at lower cost levels. A product with a $40 cost on a $100 price has a 60% margin but a 150% markup. As cost approaches the selling price, both percentages converge toward zero. This table illustrates why it is critical to specify whether you are discussing margin or markup in any pricing conversation -- the numbers can differ by more than double.
Case Study: Marcus's E-Commerce Fitness Brand
Marcus, a 34-year-old entrepreneur in Denver, Colorado, runs an online fitness equipment brand selling resistance bands, yoga mats, and foam rollers. In his most recent fiscal year, the business generated $480,000 in revenue. His cost of goods sold -- including product sourcing from manufacturers, inbound freight, and Amazon FBA fees -- totaled $192,000. That gives him a gross profit of $288,000 and a gross margin of 60%.
Marcus's operating expenses break down as follows: warehouse and fulfillment staff wages at $72,000, digital advertising (Google Ads and Meta Ads) at $58,000, software subscriptions (Shopify, email marketing, analytics) at $9,600, office rent at $14,400, and general administrative costs at $12,000 -- totaling $166,000 in operating expenses. His operating profit is $288,000 - $166,000 = $122,000, giving him an operating margin of 25.4%.
After accounting for $4,800 in interest on a small business loan and $28,200 in estimated federal and state taxes, Marcus arrives at a net profit of $89,000 and a net margin of 18.5%. While his gross margin is healthy for e-commerce, he notices that advertising alone consumes 12% of revenue. He decides to test reducing ad spend by $8,000 per month for one quarter while investing $3,000 per month in organic content marketing and SEO. If organic channels generate even half the sales that paid ads did, his operating margin would improve by approximately 3 percentage points.
Marcus also uses margin analysis to evaluate new product launches. Before adding a weighted jump rope to his lineup, he models the unit economics: $7.50 landed cost, $24.99 selling price, yielding a 70% gross margin per unit -- well above his blended 60%. He also runs the numbers through our Break-Even Calculator to determine he needs to sell 286 units to cover the $5,000 initial inventory investment and first-month advertising costs.
Industry Benchmark Comparison
| Industry | Avg Gross Margin | Avg Operating Margin | Avg Net Margin |
|---|---|---|---|
| Software / SaaS | 70 - 85% | 20 - 35% | 15 - 25% |
| E-Commerce / Retail | 40 - 60% | 5 - 15% | 3 - 10% |
| Professional Services | 50 - 70% | 15 - 25% | 10 - 20% |
| Restaurants / Food Service | 55 - 65% | 3 - 9% | 2 - 6% |
| Manufacturing | 25 - 40% | 8 - 15% | 5 - 10% |
| Construction | 20 - 35% | 4 - 10% | 2 - 7% |
These benchmarks reflect typical ranges across industries. Software companies enjoy high gross margins because digital products have near-zero marginal costs, but significant spending on engineering salaries and customer acquisition compresses operating margins. Restaurants often show strong gross margins on food but razor-thin net margins once labor, rent, and waste are factored in. Comparing your own margins against industry averages reveals whether your business is outperforming or underperforming peers -- and which cost category deserves the most attention.
Practical Tips for Improving Profit Margins
- Audit your COGS line by line. Request competing quotes from at least three suppliers annually. Even a 5% reduction in material costs on a $200,000 COGS base saves $10,000 per year and adds directly to gross margin. Negotiate volume discounts, consolidate orders, and evaluate whether switching to domestic or nearshore suppliers reduces shipping costs enough to offset higher unit prices.
- Eliminate unprofitable products or services. Rank every product by its individual gross margin. Products with margins below your blended average are dragging down overall profitability. Either reprice them, renegotiate their supply chain, or discontinue them and redirect resources toward higher-margin offerings.
- Reduce operating overhead strategically. Before cutting expenses, categorize each line item as revenue-generating (marketing, sales) or administrative (office supplies, subscriptions). Cut administrative costs first. For revenue-generating expenses, measure their ROI before reducing them -- a $5,000 monthly ad budget that generates $25,000 in revenue is a 5x return and should be optimized, not eliminated.
- Raise prices with data. Many small businesses undercharge because they fear losing customers. Test a 5-10% price increase on a subset of products and measure the impact on volume. If demand drops less than the percentage increase, total profit rises. A 10% price increase with only a 5% volume decrease produces higher total margin.
- Track margins monthly, not just annually. Seasonal fluctuations, supplier price changes, and shifts in product mix can erode margins quickly. Build a monthly margin dashboard and set alerts for when any margin drops below your target threshold. Use our 50/30/20 Budget Calculator to allocate your business profits wisely between reinvestment, reserves, and owner distributions.
FAQ
What is a good profit margin for a small business? A "good" net profit margin varies significantly by industry. Most small businesses target a net margin between 7% and 20%. Service-based businesses like consulting or software development often achieve 15-25% net margins due to low variable costs. Retail and e-commerce businesses typically operate between 5-12%. A net margin above 20% is considered excellent in most industries. The most important benchmark is whether your margin is improving over time and outperforming direct competitors.
What is the difference between gross margin and net margin? Gross margin only subtracts the direct costs of producing goods or services (COGS) from revenue. It measures production efficiency. Net margin subtracts all expenses -- COGS, operating costs, interest, depreciation, and taxes -- giving the final percentage of revenue retained as profit. A company can have a high gross margin but a low net margin if operating expenses, debt payments, or taxes consume most of the gross profit. Analyzing both together reveals whether profitability issues stem from pricing and production or from overhead and financing.
How do I convert between margin and markup? To convert margin to markup: Markup = Margin / (1 - Margin). A 40% margin equals 0.40 / 0.60 = 66.67% markup. To convert markup to margin: Margin = Markup / (1 + Markup). A 50% markup equals 0.50 / 1.50 = 33.33% margin. The calculator above shows both figures simultaneously so you never have to convert manually.
Why is my gross margin high but my net margin low? This indicates that operating expenses, interest payments, or taxes are consuming most of your gross profit. Common causes include excessive rent, overstaffing relative to revenue, high advertising spend with poor conversion rates, or significant debt service payments. Review each operating expense category as a percentage of revenue and compare against industry benchmarks to identify which areas are out of line.
How often should I calculate profit margins? Monthly is the recommended frequency for active businesses. This cadence catches cost increases, seasonal demand shifts, and pricing errors before they compound. At minimum, review margins quarterly. Annual-only reviews often miss problems that erode thousands of dollars before being detected. Read our guide on calculating ROI to pair margin analysis with return-on-investment tracking for a complete financial performance framework.