Guides / Retirement & Mortgage
Should You Pay Off Your Mortgage Before You Retire? The Tax Math
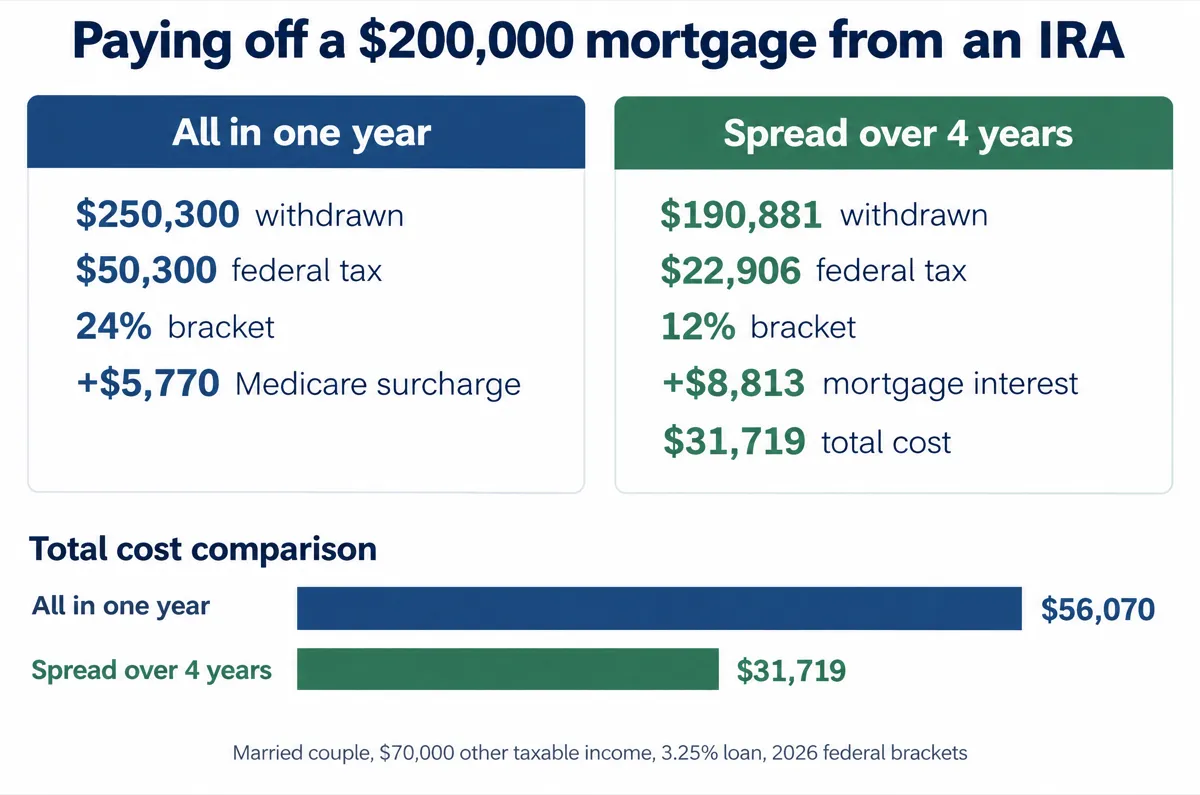
You are about to retire with $200,000 left on a 3.25% mortgage and most of your savings in a traditional IRA or 401(k). Wiping out the loan would remove a $1,134 monthly payment from your retirement budget, so it sounds like an easy win. The catch is that money in a pre-tax account is not worth $200,000 once the IRS takes its share. For a married couple in the 2026 brackets with $70,000 of other income, getting $200,000 out of an IRA in one year takes a $250,300 withdrawal and costs $50,300 in federal tax. This guide shows what the withdrawal really costs, how to cut the total cost by about $24,351, and when paying off the mortgage before retirement still makes sense.
Last updated: November 2026
Quick Answer
Pay the mortgage off before you retire when the money comes from cash, a Roth account, or investments with small gains. When it would come from a traditional IRA or 401(k), the tax bill usually decides. For a couple with $70,000 of other income, clearing $200,000 in one year takes a $250,300 withdrawal, $50,300 of federal tax, and about $5,770 of extra Medicare premiums later. Spreading the payoff over 4 years keeps every dollar in the 12% bracket and cuts the total cost to $31,719. Even then, the payoff beats keeping a 3.25% loan only if the portfolio you drain would have earned less than 3.1% a year (2.1% for the lump sum).
How Common Is a Mortgage in Retirement?
Common enough to plan for. In the Census Bureau's 2025 American Community Survey, 11.3 million owner households headed by someone 65 or older still had a mortgage, which is 36.1% of all owners in that age group. The share falls with age: 64.3% of owners 55 to 59 have a mortgage, 54.1% at 60 to 64, 41.9% at 65 to 74, and 28.7% at 75 and over. By state, the share of owners 65 and over who still owe money runs from 18.7% in North Dakota to 54.1% in the District of Columbia; the full table is in our report on mortgage-free homeowners by state.
Carrying a loan also shows up in the monthly budget. The median owner with a mortgage spends $2,163 a month on selected owner costs (payment, property tax, insurance, utilities, and association fees), against $703 for owners without one. The two groups are different households, so the $1,460 gap is not the exact saving from paying off any one loan, but it shows why a fixed payment feels heavy on a retirement income. A paid-off house still has taxes, insurance, and repairs; only the loan payment goes away.
Sources U.S. Census Bureau, ACS 2025 1-year, table B25027 (mortgage status by age of householder), U.S. Census Bureau, ACS 2025 1-year, table B25088 (median selected monthly owner costs by mortgage status), Census Bureau, 2025 ACS Subject Definitions (Mortgage Status; Selected Monthly Owner Costs). Checked November 2026. ACS figures are survey estimates with margins of error; the report page lists them for every state.
What Paying Off the Mortgage Actually Buys
Paying down a loan earns a guaranteed return equal to its interest rate. On a $200,000 balance at 3.25%, that is about $6,393 of interest avoided in the first year and $72,254 over the remaining 20 years (a $1,134 payment for 240 months). First-year interest is far below the $32,200 standard deduction for a married couple, so this household would not itemize and loses no mortgage interest deduction by paying off.
What you give up to get that return is the question. Two formulas capture it. The first is the size of the withdrawal when the money comes from a pre-tax account:
Gross withdrawal = Amount to pay ÷ (1 − Average tax rate on the withdrawal)
The average tax rate is the extra federal tax divided by the withdrawal, and it rises as the withdrawal gets bigger because each dollar pushes more income into higher brackets. In our example, $200,000 ÷ (1 − 20.1%) = $250,300. The second formula is the break-even return, the annual return your IRA would have to earn for keeping the money invested to match paying the loan off:
Gross withdrawal = Σ [ Saved gross payment ÷ (1 + r)^t ], for t = 1 to 20
- Saved gross payment: the extra IRA withdrawal you no longer need each year once the loan is gone, taxes included. A $13,613 annual payment needs a $15,414 withdrawal to fund it, because the last dollars of this household's income are taxed at only 12% and 10%.
- r: the break-even annual return, found by solving the equation numerically.
- t: the years left on the loan, which is where the payment savings stop.
The formula is exact for a one-time payoff. For a payoff spread over several years, each withdrawal compounds from the year it is taken and the savings begin once the loan is gone; the idea is the same. Plug in the lump-sum case and r comes out at 2.07%: paying $250,300 to save $15,414 a year for 20 years is equivalent to a guaranteed 2.07% return, well below the 3.25% on the loan because the withdrawal is taxed at an average 20.1% (24% at the top) while the payments it replaces would have been funded at only 10% to 12%. That tax-rate gap is the whole story, and the rest of this guide is about shrinking it.
Where the Money Comes From Changes the Answer
Four sources can fund a $200,000 payoff, and they are taxed very differently. The table assumes a married couple filing jointly with $70,000 of other income and $200,000 of cash needed after tax.
| Source | Amount taken out | Federal tax | What it costs you |
|---|---|---|---|
| Cash savings or CDs | $200,000 | $0 | The interest you stop earning, which you compare with 3.25%. Keep an emergency reserve before you spend it. |
| Roth IRA (qualified) | $200,000 | $0 | Tax-free growth you give up. Qualified Roth withdrawals do not count toward MAGI, so Medicare premiums are unaffected. |
| Taxable brokerage (40% of the sale is gain) | $203,016 | $3,016 | Long-term gains of $81,206 sit partly in the 0% bracket (taxable income up to $98,900) and the rest at 15%. |
| Traditional IRA or 401(k), one year | $250,300 | $50,300 | 20.1% average rate, 24% at the top, and a Medicare surcharge two years later. |
Cash and Roth money are the cleanest sources, but they are also the money most retirees want for emergencies and tax flexibility, so draining them to kill a 3.25% loan has its own cost. The expensive source is the one most households actually hold: the traditional IRA or 401(k). Every dollar in it carries an IRS claim that gets paid whenever the dollar leaves, and a payoff forces a large claim to be paid in a single year.
Sources IRS Rev. Proc. 2025-32 (tax year 2026 inflation adjustments), IRS federal income tax rates and brackets, IRS Topic 409, Capital Gains and Losses. Checked October 20, 2026. Federal income tax only, married filing jointly, standard deduction. Brokerage tax uses the long-term 0%, 15%, and 20% brackets and ignores the 3.8% net investment income tax, which does not apply below $250,000 of MAGI for joint filers.
Why a Big IRA Withdrawal Costs So Much: The Bracket Staircase
For 2026, a married couple filing jointly has a $32,200 standard deduction. The 10% bracket ends at $24,800 of taxable income, 12% at $100,800, 22% at $211,400, and 24% at $403,550. Adding the standard deduction, a couple stays in the 12% bracket until gross income reaches $133,000. A household that already has $70,000 of income has $63,000 of room left at 12%. Anything above that is taxed at 22% or 24%, which is what makes a $250,300 withdrawal so expensive.
The table shows what it costs to take out enough to net different payoff amounts in a single year. The $200,000 row is the lump-sum case.
| Cash needed after tax | IRA withdrawal | Federal tax | Average rate | Top bracket | Total income (MAGI) | Medicare surcharge, later |
|---|---|---|---|---|---|---|
| $50,000 | $56,818 | $6,818 | 12.0% | 12% | $126,818 | None |
| $100,000 | $120,128 | $20,128 | 16.8% | 22% | $190,128 | None |
| $150,000 | $184,511 | $34,511 | 18.7% | 24% | $254,511 | $2,297 a year |
| $200,000 | $250,300 | $50,300 | 20.1% | 24% | $320,300 | $5,770 a year |
Notice how the cost per dollar climbs. The first $100,000 of payoff costs $20,128 in tax (16.8% of the withdrawal); the second $100,000 costs $30,172 more, an incremental rate of 23.2%. Big, rare withdrawals are the most expensive way to move IRA money; small, repeated ones are the cheapest.
Two Costs That Most Payoff Plans Miss
Medicare premium surcharges (IRMAA)
Medicare charges higher Part B and Part D premiums when income is high, and the measure is MAGI, which includes IRA withdrawals. For 2026 the first surcharge starts above $218,000 for a joint return ($109,000 for a single filer). Social Security generally uses the tax return from two years earlier, so a payoff at 63 or 64 shows up in premiums at 65 or 66. The tiers for couples are below, with the extra yearly cost when both spouses are enrolled.
| MAGI, married filing jointly | Extra Part B, per person per month | Extra Part D, per person per month | Extra cost, couple, per year |
|---|---|---|---|
| $218,000 or less | None | None | None |
| Above $218,000 up to $274,000 | $81.20 | $14.50 | $2,297 |
| Above $274,000 up to $342,000 | $202.90 | $37.50 | $5,770 |
| Above $342,000 up to $410,000 | $324.60 | $60.40 | $9,240 |
| Above $410,000, under $750,000 | $446.30 | $83.30 | $12,710 |
| $750,000 or more | $487.00 | $91.00 | $13,872 |
The $250,300 lump-sum withdrawal pushes the couple's MAGI to $320,300, into the second surcharge tier (MAGI above $274,000 up to $342,000), which adds about $5,770 for the one premium year that return is used. The standard 2026 Part B premium is $202.90 a month, so the surcharge is large: in that tier each person's Part B premium doubles to $405.80 before the Part D add-on of $37.50. The surcharge is a cliff, not a slope. A MAGI of $218,000 costs nothing; one dollar more puts both spouses in the first surcharge tier.
Source Social Security Administration: Medicare premiums, rules for higher-income beneficiaries. Checked November 2026. 2026 amounts. Premium surcharges can change each year. A couple pays the surcharge once for each spouse on Medicare.
Taxes on Social Security benefits
If you already collect Social Security, a large IRA withdrawal can also make more of your benefits taxable. Under IRS Publication 915, a married couple's benefits start to become taxable when provisional income (other income plus half of benefits) passes $32,000, and up to 85% of benefits are taxable once it passes $44,000. These thresholds are not indexed for inflation. Take two average retired-worker benefits (the SSA average was $2,092.17 a month in October 2026), about $50,000 a year, plus $30,000 of pension and interest. Without a withdrawal, $15,350 of the benefits is taxable (30.7%). Add a $250,300 IRA withdrawal and the taxable part jumps to $42,500 (85%), an extra $27,150 of taxable income that costs roughly $6,516 in additional federal tax on top of the tax on the withdrawal itself.
Sources IRS Publication 915, Social Security and Equivalent Railroad Retirement Benefits, Social Security Administration, Monthly Statistical Snapshot, October 2026 (released November 2026). Checked November 2026. Worksheet 1 of Publication 915, married filing jointly. The result assumes a withdrawal of the same size and ignores state tax.
Case Study: Greg and Maria Alvarez in San Antonio
Greg and Maria are both 63 and retiring this year in San Antonio, where there is no state income tax. They have $1,100,000 in traditional IRAs and 401(k)s, $140,000 in Roth IRAs, and a $45,000 cash reserve, with no taxable brokerage account. Maria's pension pays $28,000 a year and they draw $42,000 from the IRAs for living costs, so their income is $70,000 before any payoff. They plan to claim Social Security at 67. Their mortgage has $200,000 left at 3.25% with 20 years to go, a $1,134 payment. The cash reserve is too small to retire the loan and the Roth money is the part they want to keep, so the only realistic source is the traditional accounts.
The table prices six ways to get to zero, from one big withdrawal to six equal annual steps. In every staged plan the payments continue between steps, so the later steps are smaller, but interest keeps accruing while the loan is open. Cost means federal tax on the withdrawals, mortgage interest paid before the loan is gone, and Medicare surcharges.
| Payoff plan | Total IRA withdrawals | Federal tax | Interest while waiting | Medicare surcharge | Total cost |
|---|---|---|---|---|---|
| All at once | $250,300 | $50,300 | $0 | $5,770 | $56,070 |
| 2 yearly steps | $226,771 | $37,290 | $3,094 | None | $40,384 |
| 3 yearly steps | $205,776 | $26,968 | $6,033 | None | $33,001 |
| 4 yearly steps | $190,881 | $22,906 | $8,813 | None | $31,719 |
| 5 yearly steps | $178,388 | $21,407 | $11,432 | None | $32,838 |
| 6 yearly steps | $165,706 | $19,885 | $13,885 | None | $33,770 |
The cheapest route is 4 steps at $31,719, which is $24,351 less than the lump sum. Fewer steps cost more tax because each step lands higher in the brackets; more steps cost more interest because the loan stays open longer. Four steps also keep the peak income at $126,818, comfortably under the $218,000 Medicare line, and the largest single withdrawal of $56,818 fits inside their $63,000 of room at 12%. Here is the year-by-year schedule.
| Year | Loan paid off that year | IRA withdrawal | Federal tax | Top bracket | Total income (MAGI) |
|---|---|---|---|---|---|
| Year 1 (age 63) | $50,000 | $56,818 | $6,818 | 12% | $126,818 |
| Year 2 (age 64) | $47,044 | $53,459 | $6,415 | 12% | $123,459 |
| Year 3 (age 65) | $41,687 | $47,371 | $5,685 | 12% | $117,371 |
| Year 4 (age 66) | $29,245 | $33,233 | $3,988 | 12% | $103,233 |
The last step lands at age 66, the year before Greg and Maria plan to start Social Security, so none of the withdrawals stack on top of taxable benefits. That timing is a quiet advantage of paying off in the gap years between retiring and claiming.
Is paying off worth it at all? The 4-year plan costs money up front, so the real test is against keeping the loan. At their 3.25% rate the break-even return is 3.11%. In plain terms, paying off earns Greg and Maria a guaranteed 3.1% a year for 20 years after the tax cost of freeing up the money. If their portfolio earns more than that, keeping the loan wins; if it earns less, paying off wins. The next section puts dollars on that.
The Break-Even: What Must Your Portfolio Earn?
The break-even return is the yield that paying off is worth, after counting the tax on the money you take out. The table solves it for four loan rates on a $200,000 balance with 20 years left, for the one-year lump sum and the 4-year plan. The last row uses 7.11%, the Freddie Mac 30-year average on November 12, 2026, as the rate on a hypothetical new loan.
| Mortgage rate | Lump sum: keeping wins if portfolio earns more than | 4-year plan: keeping wins if portfolio earns more than |
|---|---|---|
| 3.25% | 2.1% a year | 3.1% a year |
| 4.50% | 3.2% a year | 4.3% a year |
| 6.00% | 4.6% a year | 5.8% a year |
| 7.11% (November 12, 2026) | 5.6% a year | 6.9% a year |
Two patterns stand out. First, keeping the loan beats the lump sum at a much lower portfolio return, at every rate, because the lump sum pays tax at higher brackets. Second, the 4-year plan lands within about 0.2 percentage points of the loan rate in every row, so a staged payoff from pre-tax money is nearly equal to a guaranteed return at the mortgage rate. That makes the question one of risk, not arithmetic: if your portfolio will earn more than the loan rate on average, you accept volatility to come out ahead by keeping the loan.
Here is the same 3.25% comparison in dollars. Each cell shows how much larger or smaller the IRA is after 20 years in pre-tax dollars, assuming a constant return.
| Portfolio return | Lump sum | 4-year plan |
|---|---|---|
| 2.0% a year | Paying off ahead by $2,590 | Paying off ahead by $31,968 |
| 3.0% a year | Keeping the loan ahead by $37,887 | Paying off ahead by $3,500 |
| 4.0% a year | Keeping the loan ahead by $89,436 | Keeping the loan ahead by $32,549 |
| 6.0% a year | Keeping the loan ahead by $235,729 | Keeping the loan ahead by $133,794 |
| 8.0% a year | Keeping the loan ahead by $461,258 | Keeping the loan ahead by $287,568 |
At 2.0% the 4-year payoff finishes $31,968 ahead; at 4.0% keeping the loan is $32,549 ahead, and at 6.0% it is $133,794 ahead. The lump sum is behind at every return above 2.1%, by $235,729 at 6.0%. The model is deliberately simple: constant 2026 brackets and a constant $70,000 of other income for 20 years, withdrawals at the start of each year, saved payments counted at year-end, no Medicare or Social Security effects in the break-even, and no change in spending. Real years will differ, but the order of the results is robust: staged beats lump sum, and the keep-or-pay decision turns on your expected return against the loan rate.
Greg and Maria’s decision
They rule out the lump sum immediately: it costs $24,351 more than the 4-year plan and triggers Medicare surcharges. Between the staged payoff and keeping the loan, the math is close at 3.25%, so they decide on risk. Maria's pension covers only $28,000 of their $70,000 budget, and Greg does not want a fixed $13,613 yearly payment competing with IRA withdrawals in a down market. They choose the 4-year plan, finishing at 66, and accept a guaranteed 3.1% instead of betting their portfolio will beat it. A household with a 6% loan would not face a close call: the 4-year break-even there is 5.8%, which asks a portfolio to beat a guaranteed 5.8% every year for 20 years.
When Paying Off Wins, and When Keeping the Loan Wins
Pay it off when
- The loan rate is high. At 7.11% the 4-year break-even is 6.9%; at 6% it is 5.8%. Few portfolios beat those returns without large swings.
- The money comes from cash, a Roth account, or shares with small gains. The tax cost is near zero, so the payoff earns close to the full loan rate.
- You can do it in the low-income gap years, before Social Security and before required distributions, and keep each year in the 12% bracket.
- Fixed costs are the risk. A $13,613 yearly payment would take a portfolio of about $340,000 to fund at the 4% rule of thumb, and unlike a portfolio withdrawal it never adjusts when markets fall.
Source William Bengen, Journal of Financial Planning (Oct. 1994 reprint PDF). Checked November 2026. The 4% rule is a historical simulation, not an IRS or SSA rule; read our guide on how much you need to retire for its limits.
Keep the loan when
- The rate is low and the money is pre-tax. At 3.25% the 4-year break-even is 3.1%, and at 4.5% it is 4.3%.
- The only way to fund it is a single large withdrawal. The lump-sum case costs $24,351 more than the staged plan in our example.
- It would drain cash you need for emergencies, or money you have earmarked for Roth conversions, a bequest, or long-term care.
- A one-time withdrawal would push MAGI above $218,000 in a year Medicare will use to set your premiums at 65 or later.
How to Decide in Six Steps
- Get a payoff quote from your servicer: the balance, the rate, the remaining term, and the payment. Greg and Maria's is $200,000, 3.25%, 240 months, and $1,134.
- List your accounts by tax type: cash, Roth, taxable (with cost basis), and traditional. Only the traditional balances carry a payoff tax of the kind described above.
- Find your income without the payoff, then the room left in your bracket. For a couple, the 12% bracket ends at $133,000 of gross income in 2026; with $70,000 already planned, the room is $63,000 a year.
- Compare your loan rate with the break-even table. If the rate is under about 4.5% and the money is pre-tax, lean toward keeping the loan; if it is 6.0% or higher, lean toward paying off.
- If you pay off from pre-tax money, size each year's withdrawal to the room in your bracket and the Medicare line ($218,000 of MAGI for a couple), and stretch it over as many years as the interest cost allows. Use the Amortization Calculator to see how much interest each extra year of waiting costs.
- Re-check each year. Update your income, the remaining balance, and your state's tax. Stop early if markets fall sharply and the next withdrawal would mean selling at a loss.
This guide builds on our broader comparison of paying off a mortgage early vs investing by adding the retirement-specific taxes. The 401(k) vs Roth IRA guide explains why the account you take money from matters, and our how much to retire at 55 guide shows how a mortgage payment changes the portfolio you need.
This guide is for general education, not tax or investment advice. Your own brackets, state tax, Social Security timing, and Medicare enrollment can change the result, so check the numbers with a tax professional before moving retirement money.
Run Your Own Numbers
Price the loan, see how much interest each year of waiting costs, and test the tax on a withdrawal.
FAQ
Should I pay off my mortgage before I retire?
It depends on where the money comes from and what the loan costs. Cash, a Roth account, or investments with small gains can retire a loan with little or no tax, and a rate near or above 6% strengthens the case. Pre-tax money is different: a married couple with $70,000 of other income needs a $250,300 IRA withdrawal to net $200,000, and $50,300 of that goes to federal tax. Spread over 4 years inside the 12% bracket, the same payoff costs $31,719 in tax and extra interest. Even then, a 3.25% loan is a close call: the payoff only wins if your portfolio would have earned less than 3.1% a year over the remaining 20 years.
Is it smart to use my IRA or 401(k) to pay off my mortgage?
Only in small yearly pieces and only when the loan rate is high enough to justify the tax. A lump-sum withdrawal taxed at 24% turns a $200,000 payoff into a $250,300 withdrawal, and it can add about $5,770 to Medicare premiums two years later. Splitting the payoff over 4 years kept every dollar in the 12% bracket in our example and avoided the Medicare surcharge, which lowered the total cost from $56,070 to $31,719. If your loan rate is below roughly 4.5% and the money would come from a pre-tax account, keeping the loan is usually the better financial move.
Does paying off a mortgage with an IRA withdrawal raise my Medicare premiums?
It can. Medicare adds an income-related surcharge to Part B and Part D premiums when modified adjusted gross income (MAGI) is above $218,000 for a joint return, or $109,000 for a single filer, and the Social Security Administration looks at your tax return from two years earlier. A $250,300 withdrawal on top of $70,000 of income produces MAGI of $320,300, which puts a couple in the second surcharge tier and adds about $5,770 for the premium year it is measured. Keeping each year's MAGI under $218,000, as the 4-year plan does at a peak of $126,818, avoids the surcharge entirely.
How much tax will I owe on a $200,000 IRA withdrawal?
For a married couple filing jointly with $70,000 of other income and the 2026 standard deduction of $32,200, withdrawing exactly $200,000 adds about $38,228 of federal income tax. If you need $200,000 left after tax, you must withdraw $250,300 and owe $50,300, an average rate of 20.1% on the withdrawal, with the top dollars taxed at 24%. State income tax is extra, and if you already collect Social Security, more of your benefits become taxable as well.
What mortgage rate makes paying it off worth it?
For a $200,000 balance with 20 years left, paying it off over 4 years from pre-tax money breaks even against a portfolio return of 3.1% for a 3.25% loan, 4.3% for 4.5%, 5.8% for 6.0%, and 6.9% for 7.11%, the Freddie Mac 30-year average on November 12, 2026. Treat the break-even as the guaranteed yield you earn by paying off. If your portfolio can reasonably earn more than that and you can tolerate the swings, keeping the loan wins; if not, payoff wins. The lump sum breaks even at a lower return, so it is the weaker plan at every rate in the table.
How many retirees still have a mortgage?
11.3 million owner households headed by someone 65 or older had a mortgage in the Census Bureau's 2025 American Community Survey, which is 36.1% of owners that age. The share is 64.3% at ages 55 to 59 and 28.7% at 75 and over, so the share falls steadily with age. By state it ranges from 18.7% in North Dakota to 54.1% in the District of Columbia.
Sources IRS federal income tax rates and brackets, Social Security Administration: Medicare premiums, rules for higher-income beneficiaries, Freddie Mac, Primary Mortgage Market Survey, U.S. Census Bureau, ACS 2025 1-year, table B25027 (mortgage status by age of householder). Checked November 2026. The 7.11% rate is the Freddie Mac 30-year fixed average for the week of November 12, 2026.
Related Guides
Pay Off Mortgage Early vs Invest: The Math Behind the Decision
Should you pay off your mortgage early or invest the extra money? We run the real numbers at today's rates so you can see exactly which option builds more wealth.
401(k) vs Roth IRA: Which Retirement Account Is Better for You?
Compare 401(k) vs Roth IRA: contribution limits, tax treatment, income limits, and when each wins. Includes a case study and the optimal hybrid strategy.
How Much Do I Need to Retire at 55? A Complete Breakdown
Find out how much you need to retire at 55. Covers the 4% rule, healthcare costs before Medicare, portfolio targets by lifestyle, and a step-by-step plan.